

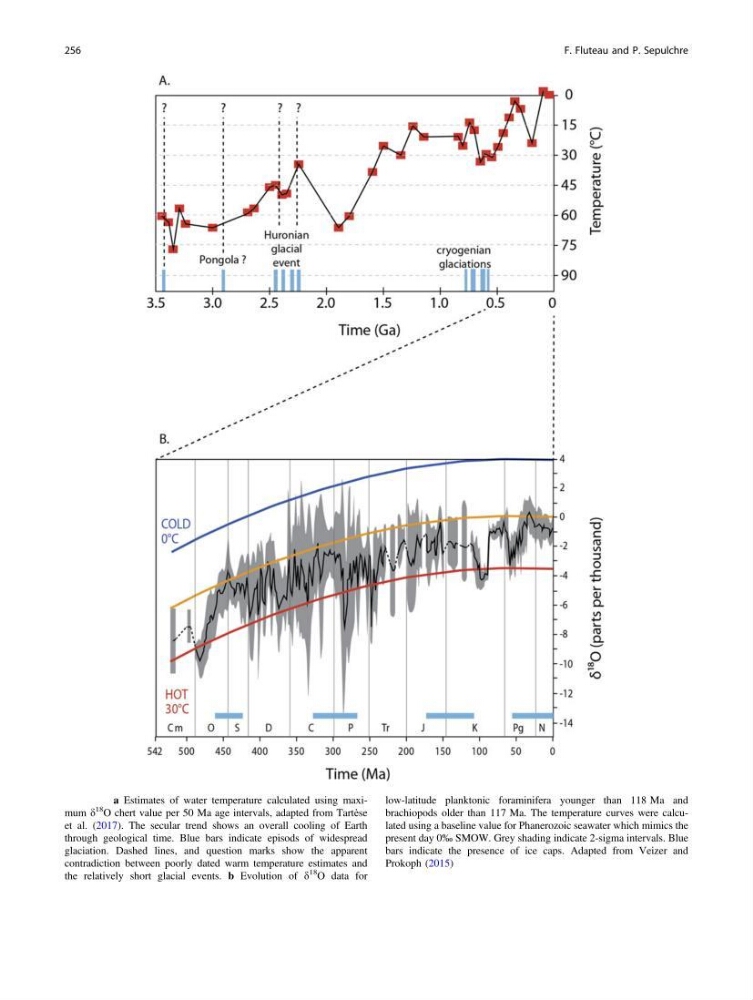
Fig. 22.1 a Estimates of water temperature calculated using maximum d
18
O chert value per 50 Ma age intervals, adapted from Tartèse
et al. (2017). The secular trend shows an overall cooling of Earth
through geological time. Blue bars indicate episods of widespread
glaciation. Dashed lines, and question marks show the apparent
contradiction between poorly dated warm temperature estimates and
the relatively short glacial events. b Evolution of d
18
O data for
low-latitude planktonic foraminifera younger than 118 Ma and
brachiopods older than 117 Ma. The temperature curves were calculated using a baseline value for Phanerozoic seawater which mimics the
present day 0‰ SMOW. Grey shading indicate 2-sigma intervals. Blue
bars indicate the presence of ice caps. Adapted from Veizer and
Prokoph (2015)
256
F. Fluteau and P. Sepulchre
18
O chert value per 50 Ma age intervals, adapted from Tartèse
et al. (2017). The secular trend shows an overall cooling of Earth
through geological time. Blue bars indicate episods of widespread
glaciation. Dashed lines, and question marks show the apparent
contradiction between poorly dated warm temperature estimates and
the relatively short glacial events. b Evolution of d
18
O data for
low-latitude planktonic foraminifera younger than 118 Ma and
brachiopods older than 117 Ma. The temperature curves were calculated using a baseline value for Phanerozoic seawater which mimics the
present day 0‰ SMOW. Grey shading indicate 2-sigma intervals. Blue
bars indicate the presence of ice caps. Adapted from Veizer and
Prokoph (2015)
256
F. Fluteau and P. Sepulchre