

Strictly speaking, the interglacial comparable to the period we live in, and defined by an ice volume minimum is
called the Last Interglacial, and runs from about 129–116 ka
(Govin et al. 2015; Dutton et al. 2015). From 115 ka, the
midpoint of the transition marking the entry into MIS 5d, ice
volume had already increased significantly, so much so that
sea level dropped by as much as −40 m at the height of MIS
5d at about 110 ka.
During the Last Interglacial, the insolation forcing was
characterized by a relatively high eccentricity, the combination of a strong inclination and a perihelion close to the
summer solstice. This orbital configuration triggered an
increase in summer insolation in the northern hemisphere of
more than 30 W/m
2 compared to the present day. Despite
these differences in forcing, the general evolution of the Last
Interglacial climate is to a first degree quite similar to that of
the Holocene: high temperatures at higher northern latitudes
until about 123 ka (in line with higher insolation and higher
elevation of the sun on the horizon), followed by a gradual
cooling linked to the decline in boreal summer insolation in
parallel with the progressive growth of glacial conditions
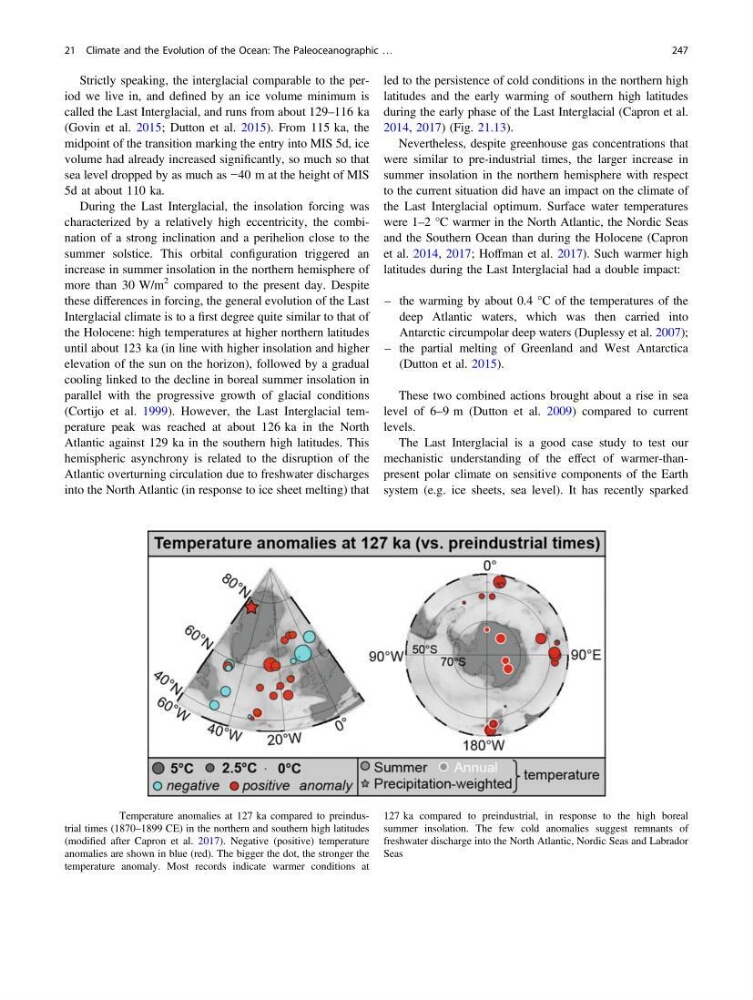
(Cortijo et al. 1999). However, the Last Interglacial temperature peak was reached at about 126 ka in the North
Atlantic against 129 ka in the southern high latitudes. This
hemispheric asynchrony is related to the disruption of the
Atlantic overturning circulation due to freshwater discharges
into the North Atlantic (in response to ice sheet melting) that
led to the persistence of cold conditions in the northern high
latitudes and the early warming of southern high latitudes
during the early phase of the Last Interglacial (Capron et al.
2014, 2017) (Fig. 21.13).
Nevertheless, despite greenhouse gas concentrations that
were similar to pre-industrial times, the larger increase in
summer insolation in the northern hemisphere with respect
to the current situation did have an impact on the climate of
the Last Interglacial optimum. Surface water temperatures
were 1–2 °C warmer in the North Atlantic, the Nordic Seas
and the Southern Ocean than during the Holocene (Capron
et al. 2014, 2017; Hoffman et al. 2017). Such warmer high
latitudes during the Last Interglacial had a double impact:
– the warming by about 0.4 °C of the temperatures of the
deep Atlantic waters, which was then carried into
Antarctic circumpolar deep waters (Duplessy et al. 2007);
– the partial melting of Greenland and West Antarctica
(Dutton et al. 2015).
These two combined actions brought about a rise in sea
level of 6–9 m (Dutton et al. 2009) compared to current
levels.
The Last Interglacial is a good case study to test our
mechanistic understanding of the effect of warmer-thanpresent polar climate on sensitive components of the Earth
system (e.g. ice sheets, sea level). It has recently sparked
Fig. 21.13 Temperature anomalies at 127 ka compared to preindustrial times (1870–1899 CE) in the northern and southern high latitudes
(modified after Capron et al. 2017). Negative (positive) temperature
anomalies are shown in blue (red). The bigger the dot, the stronger the
temperature anomaly. Most records indicate warmer conditions at
127 ka compared to preindustrial, in response to the high boreal
summer insolation. The few cold anomalies suggest remnants of
freshwater discharge into the North Atlantic, Nordic Seas and Labrador
Seas
21 Climate and the Evolution of the Ocean: The Paleoceanographic …
247
called the Last Interglacial, and runs from about 129–116 ka
(Govin et al. 2015; Dutton et al. 2015). From 115 ka, the
midpoint of the transition marking the entry into MIS 5d, ice
volume had already increased significantly, so much so that
sea level dropped by as much as −40 m at the height of MIS
5d at about 110 ka.
During the Last Interglacial, the insolation forcing was
characterized by a relatively high eccentricity, the combination of a strong inclination and a perihelion close to the
summer solstice. This orbital configuration triggered an
increase in summer insolation in the northern hemisphere of
more than 30 W/m
2 compared to the present day. Despite
these differences in forcing, the general evolution of the Last
Interglacial climate is to a first degree quite similar to that of
the Holocene: high temperatures at higher northern latitudes
until about 123 ka (in line with higher insolation and higher
elevation of the sun on the horizon), followed by a gradual
cooling linked to the decline in boreal summer insolation in
parallel with the progressive growth of glacial conditions
(Cortijo et al. 1999). However, the Last Interglacial temperature peak was reached at about 126 ka in the North
Atlantic against 129 ka in the southern high latitudes. This
hemispheric asynchrony is related to the disruption of the
Atlantic overturning circulation due to freshwater discharges
into the North Atlantic (in response to ice sheet melting) that
led to the persistence of cold conditions in the northern high
latitudes and the early warming of southern high latitudes
during the early phase of the Last Interglacial (Capron et al.
2014, 2017) (Fig. 21.13).
Nevertheless, despite greenhouse gas concentrations that
were similar to pre-industrial times, the larger increase in
summer insolation in the northern hemisphere with respect
to the current situation did have an impact on the climate of
the Last Interglacial optimum. Surface water temperatures
were 1–2 °C warmer in the North Atlantic, the Nordic Seas
and the Southern Ocean than during the Holocene (Capron
et al. 2014, 2017; Hoffman et al. 2017). Such warmer high
latitudes during the Last Interglacial had a double impact:
– the warming by about 0.4 °C of the temperatures of the
deep Atlantic waters, which was then carried into
Antarctic circumpolar deep waters (Duplessy et al. 2007);
– the partial melting of Greenland and West Antarctica
(Dutton et al. 2015).
These two combined actions brought about a rise in sea
level of 6–9 m (Dutton et al. 2009) compared to current
levels.
The Last Interglacial is a good case study to test our
mechanistic understanding of the effect of warmer-thanpresent polar climate on sensitive components of the Earth
system (e.g. ice sheets, sea level). It has recently sparked
Fig. 21.13 Temperature anomalies at 127 ka compared to preindustrial times (1870–1899 CE) in the northern and southern high latitudes
(modified after Capron et al. 2017). Negative (positive) temperature
anomalies are shown in blue (red). The bigger the dot, the stronger the
temperature anomaly. Most records indicate warmer conditions at
127 ka compared to preindustrial, in response to the high boreal
summer insolation. The few cold anomalies suggest remnants of
freshwater discharge into the North Atlantic, Nordic Seas and Labrador
Seas
21 Climate and the Evolution of the Ocean: The Paleoceanographic …
247