

but that from 500 BC, the gap increased sharply to almost
800 years at 5500 years BC.
A systematic study of this phenomenon was then carried
out in the 1980s and 1990s by several laboratories on blocks
of rings from American pines, oaks and European Scots
pines. After publication in 1993, these curves, called radiocarbon calibration curves, established by thousands of
measurements, constituted the basis on which corrections are
now possible for the entire Holocene period, and currently,
for the past 12,400 years (Stuiver et al. 1998). Extended into
the past through the dating of tropical reef corals, varved
sediments and speleothems (see Chap. 4), the calibration
curves obtained from tree ring data are now being extended
using series of dated tree rings series from Bølling Allerød
and from Younger Dryas in Germany, the area around
Zürich, Northwest Italy and watersheds of tributaries in the
mid Durance valley (France).
The correction curve for
14
C dates in calendar years
shows that the actual time seems compressed by about 15%
before the sixth millennium BC, that there are plateaus along
the curve (for example, around 500 BC. or during the ninth
and tenth millennia BC.), and that multiple small fluctuations
can, for some periods, affect the rectilinear shape of the
curve. The practical consequences of these types of variations, showing that variations in concentration of atmospheric
14
C have been erratic, are very different: small
fluctuations, after correction, can result in particularly inaccurate dates; but in some cases, very precise dates can be
achieved for those periods particularly affected by fluctuations in the atmospheric content of
14 C.
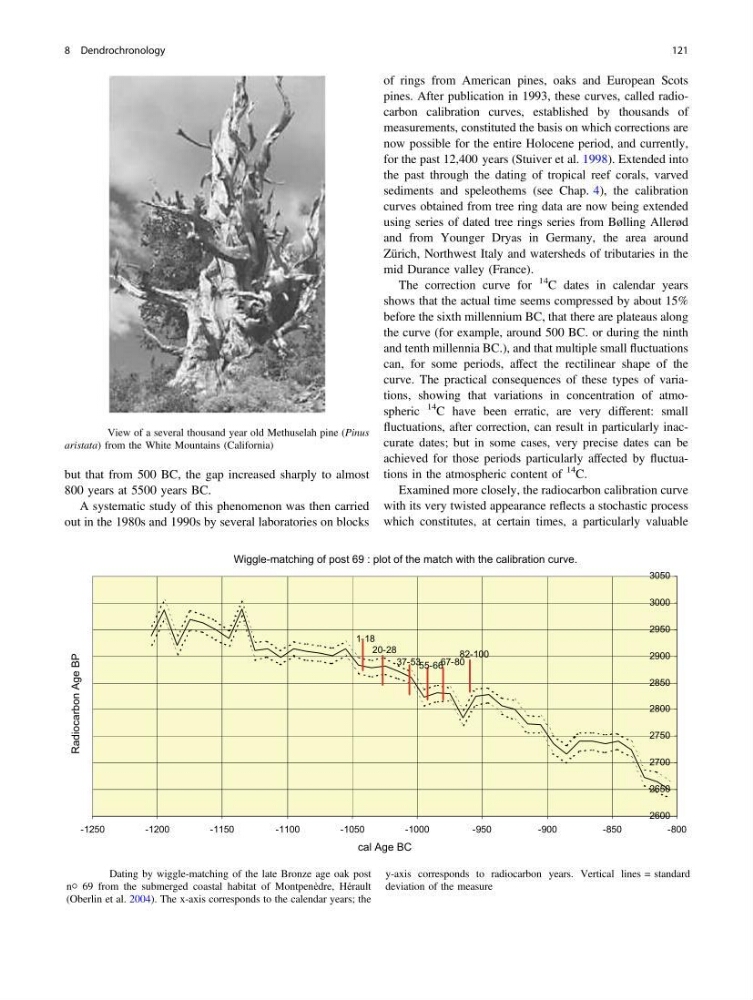
Examined more closely, the radiocarbon calibration curve
with its very twisted appearance reflects a stochastic process
which constitutes, at certain times, a particularly valuable
Fig. 8.4 View of a several thousand year old Methuselah pine (Pinus
aristata) from the White Mountains (California)
Wiggle-matching of post 69 : plot of the match with the calibration curve.
2600
2650
2700
2750
2800
2850
2900
2950
3000
3050
-1250
-1200
-1150
-1100
-1050
-1000
-950
-900
-850
-800
cal Age BC
Radiocarbon Age BP
1-18
20-28
37-53 55-66 67-80
82-100
Fig. 8.5 Dating by wiggle-matching of the late Bronze age oak post
n◦ 69 from the submerged coastal habitat of Montpenèdre, Hérault
(Oberlin et al. 2004). The x-axis corresponds to the calendar years; the
y-axis corresponds to radiocarbon years. Vertical lines = standard
deviation of the measure
8 Dendrochronology
121
800 years at 5500 years BC.
A systematic study of this phenomenon was then carried
out in the 1980s and 1990s by several laboratories on blocks
of rings from American pines, oaks and European Scots
pines. After publication in 1993, these curves, called radiocarbon calibration curves, established by thousands of
measurements, constituted the basis on which corrections are
now possible for the entire Holocene period, and currently,
for the past 12,400 years (Stuiver et al. 1998). Extended into
the past through the dating of tropical reef corals, varved
sediments and speleothems (see Chap. 4), the calibration
curves obtained from tree ring data are now being extended
using series of dated tree rings series from Bølling Allerød
and from Younger Dryas in Germany, the area around
Zürich, Northwest Italy and watersheds of tributaries in the
mid Durance valley (France).
The correction curve for
14
C dates in calendar years
shows that the actual time seems compressed by about 15%
before the sixth millennium BC, that there are plateaus along
the curve (for example, around 500 BC. or during the ninth
and tenth millennia BC.), and that multiple small fluctuations
can, for some periods, affect the rectilinear shape of the
curve. The practical consequences of these types of variations, showing that variations in concentration of atmospheric
14
C have been erratic, are very different: small
fluctuations, after correction, can result in particularly inaccurate dates; but in some cases, very precise dates can be
achieved for those periods particularly affected by fluctuations in the atmospheric content of
14 C.
Examined more closely, the radiocarbon calibration curve
with its very twisted appearance reflects a stochastic process
which constitutes, at certain times, a particularly valuable
Fig. 8.4 View of a several thousand year old Methuselah pine (Pinus
aristata) from the White Mountains (California)
Wiggle-matching of post 69 : plot of the match with the calibration curve.
2600
2650
2700
2750
2800
2850
2900
2950
3000
3050
-1250
-1200
-1150
-1100
-1050
-1000
-950
-900
-850
-800
cal Age BC
Radiocarbon Age BP
1-18
20-28
37-53 55-66 67-80
82-100
Fig. 8.5 Dating by wiggle-matching of the late Bronze age oak post
n◦ 69 from the submerged coastal habitat of Montpenèdre, Hérault
(Oberlin et al. 2004). The x-axis corresponds to the calendar years; the
y-axis corresponds to radiocarbon years. Vertical lines = standard
deviation of the measure
8 Dendrochronology
121