

work, followed by Wensink (1966), led to a subdivision of
Icelandic Pliocene-Pleistocene lava in three polarity zones:
normal-inverse-normal, from most recent to oldest. Afterwards, the joint use of paleomagnetic measures and
potassium/argon dating (K-Ar, Chap. 5) by Cox et al. (1963)
and McDougall and Tarling (1963a, b) marked the beginning of the development of the modern scale of magnetic
polarities (Geomagnetic Polarity Time Scale, GPTS).
The first examples of magnetostratigraphic measures
obtained from sedimentary sequences were those by Creer
et al. (1954) and by Irving and Runcorn (1957), which
demonstrated alternating positive and negative polarity in
thirteen sites of Torridonian sandstone in Scotland, and in
Devonian and Triassic rocks. In parallel, Khramov (1960)
published
magnetostratigraphic
results
from
Pliocene-Pleistocene sediments in Turkmenistan, and proceeded to develop chromolithographic interpretations based
on the assumption that the durations of the different polarity
periods were identical. We now know that this assumption is
unfounded. Other pioneering studies of magnetostratigraphy
were carried out on red Triassic sandstone from the Chugwater Formation, on the European Triassic Bundsanstein and
on the Moenkopi Formation from the Lower Triassic (see
Opdyke and Channell 1996). All these studies were conducted on sandstone and silt mainly of continental origin,
largely devoid of fauna, and therefore, the correlations based
on the identification of polarity intervals were not supported
by biostratigraphic correlations.
The first studies of marine sediments from the
Pliocene-Pleistocene collected by coring in high southern
latitudes (Opdyke et al. 1966) mark the beginning of modern
magnetostratigraphy. These studies, combining magnetostratigraphy and biostratigraphy, improved and expanded
the Geomagnetic Polarity Time-Scale (GPTS), which was
obtained by the paleomagnetic study of basaltic outcrops and
marine magnetic anomalies (MMA) (e.g. Heirtzler et al.
1968).
Over the past two decades, significant technical developments have enabled the dating of recent volcanic formations
and sedimentary formations. In parallel, the development of
corers like the Hydraulic Piston Corer from the Ocean Drilling Program (ODP) or the CALYPSO corer on board the
research vessel Marion Dufresne of the French Polar Institute
(IPEV) allowed the sampling of very long marine sedimentary sequences, with very high sedimentation rates. Thus, it
was demonstrated that certain very brief changes in the
magnetic polarity of the sediment, initially thought to be due
to sampling artifacts, or to re-magnetization phenomena or to
various sedimentary processes, were, in reality, reflecting
coherent reversals in the polarity of the geomagnetic field,
which are observed simultaneously at different locations on
the surface of the globe. These “geomagnetic excursions”,
which occurred during periods previously considered
“stable”, such as the Brunhes or Matuyama periods, provide
an exceptional tool for correlations over long distances.
Provided that these excursions are well dated (on volcanic
rocks with records of intermediary or reversed paleomagnetic
directions), it is possible to establish a scale of geomagnetic
instabilities (GITS = Geomagnetic Instabilities Time Scale),
allowing a better temporal resolution than the scale of magnetic polarities.
Finally, over the last decade, a new method of magnetic
correlation, based on the variations in intensity of the Earth’s
magnetic field, has been proposed. The records of geomagnetic paleointensity obtained from marine sediments contain
a global signal, which is a global-scale correlation tool at an
exceptional time resolution. Although this new method is
more restrictive in its use (it requires a high level of
homogeneity of the magnetic mineralogy of the sediments),
it potentially allows cross-comparison with the stratigraphy
of ice cores. As variations in geomagnetic paleointensity
control the production of cosmogenic isotopes, like
10 Be and
36 Cl in the upper atmosphere, their flux, measured in ice
cores from Greenland and Antarctica, is inversely correlated
with these variations. This makes it possible to envisage a
correlation between ice and marine sediments.
Below, we examine in turn the three major developments
in magnetostratigraphy, first the polarity scale, then the scale
of geomagnetic instabilities, and finally the development of
the method of correlation by paleointensity. We adopt a
“historical” approach, retracing the different stages and the
main challenges encountered, and we will also attempt to
highlight not only the advantages, but also the limitations of
each method. We will illustrate, through examples, the
unique role that magnetostratigraphy can play, especially in
understanding the mechanisms of climate variability, by
allowing the evaluation and possible quantification of temporal phase differences between various regions and between
different records (ocean, cryosphere, land).
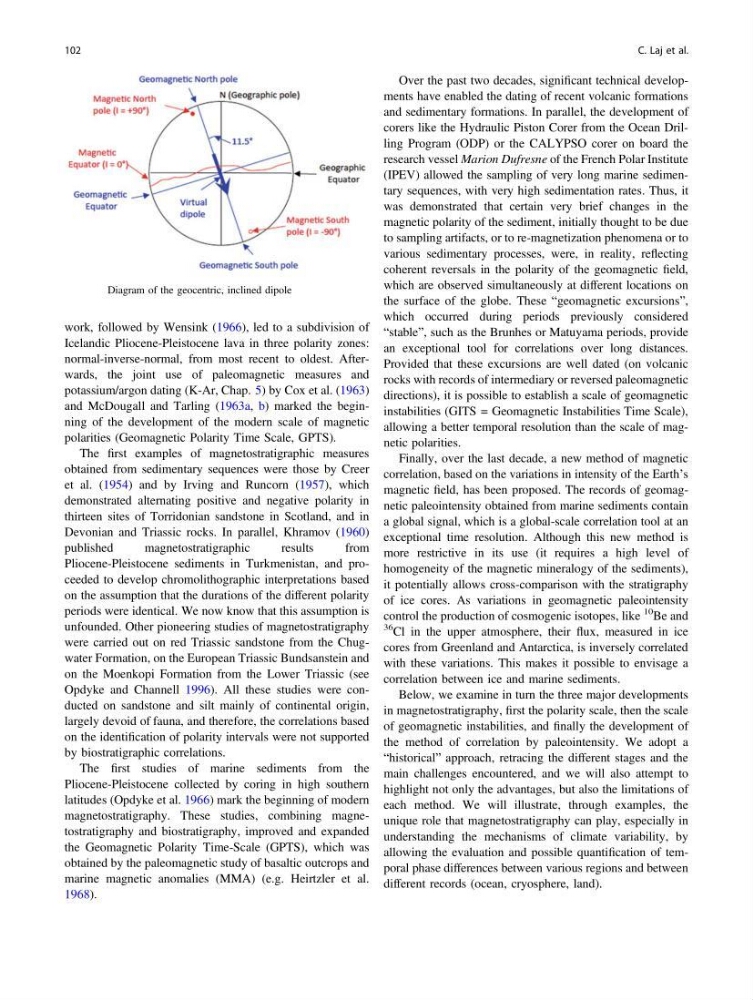
Fig. 7.1 Diagram of the geocentric, inclined dipole
102
C. Laj et al.
Icelandic Pliocene-Pleistocene lava in three polarity zones:
normal-inverse-normal, from most recent to oldest. Afterwards, the joint use of paleomagnetic measures and
potassium/argon dating (K-Ar, Chap. 5) by Cox et al. (1963)
and McDougall and Tarling (1963a, b) marked the beginning of the development of the modern scale of magnetic
polarities (Geomagnetic Polarity Time Scale, GPTS).
The first examples of magnetostratigraphic measures
obtained from sedimentary sequences were those by Creer
et al. (1954) and by Irving and Runcorn (1957), which
demonstrated alternating positive and negative polarity in
thirteen sites of Torridonian sandstone in Scotland, and in
Devonian and Triassic rocks. In parallel, Khramov (1960)
published
magnetostratigraphic
results
from
Pliocene-Pleistocene sediments in Turkmenistan, and proceeded to develop chromolithographic interpretations based
on the assumption that the durations of the different polarity
periods were identical. We now know that this assumption is
unfounded. Other pioneering studies of magnetostratigraphy
were carried out on red Triassic sandstone from the Chugwater Formation, on the European Triassic Bundsanstein and
on the Moenkopi Formation from the Lower Triassic (see
Opdyke and Channell 1996). All these studies were conducted on sandstone and silt mainly of continental origin,
largely devoid of fauna, and therefore, the correlations based
on the identification of polarity intervals were not supported
by biostratigraphic correlations.
The first studies of marine sediments from the
Pliocene-Pleistocene collected by coring in high southern
latitudes (Opdyke et al. 1966) mark the beginning of modern
magnetostratigraphy. These studies, combining magnetostratigraphy and biostratigraphy, improved and expanded
the Geomagnetic Polarity Time-Scale (GPTS), which was
obtained by the paleomagnetic study of basaltic outcrops and
marine magnetic anomalies (MMA) (e.g. Heirtzler et al.
1968).
Over the past two decades, significant technical developments have enabled the dating of recent volcanic formations
and sedimentary formations. In parallel, the development of
corers like the Hydraulic Piston Corer from the Ocean Drilling Program (ODP) or the CALYPSO corer on board the
research vessel Marion Dufresne of the French Polar Institute
(IPEV) allowed the sampling of very long marine sedimentary sequences, with very high sedimentation rates. Thus, it
was demonstrated that certain very brief changes in the
magnetic polarity of the sediment, initially thought to be due
to sampling artifacts, or to re-magnetization phenomena or to
various sedimentary processes, were, in reality, reflecting
coherent reversals in the polarity of the geomagnetic field,
which are observed simultaneously at different locations on
the surface of the globe. These “geomagnetic excursions”,
which occurred during periods previously considered
“stable”, such as the Brunhes or Matuyama periods, provide
an exceptional tool for correlations over long distances.
Provided that these excursions are well dated (on volcanic
rocks with records of intermediary or reversed paleomagnetic
directions), it is possible to establish a scale of geomagnetic
instabilities (GITS = Geomagnetic Instabilities Time Scale),
allowing a better temporal resolution than the scale of magnetic polarities.
Finally, over the last decade, a new method of magnetic
correlation, based on the variations in intensity of the Earth’s
magnetic field, has been proposed. The records of geomagnetic paleointensity obtained from marine sediments contain
a global signal, which is a global-scale correlation tool at an
exceptional time resolution. Although this new method is
more restrictive in its use (it requires a high level of
homogeneity of the magnetic mineralogy of the sediments),
it potentially allows cross-comparison with the stratigraphy
of ice cores. As variations in geomagnetic paleointensity
control the production of cosmogenic isotopes, like
10 Be and
36 Cl in the upper atmosphere, their flux, measured in ice
cores from Greenland and Antarctica, is inversely correlated
with these variations. This makes it possible to envisage a
correlation between ice and marine sediments.
Below, we examine in turn the three major developments
in magnetostratigraphy, first the polarity scale, then the scale
of geomagnetic instabilities, and finally the development of
the method of correlation by paleointensity. We adopt a
“historical” approach, retracing the different stages and the
main challenges encountered, and we will also attempt to
highlight not only the advantages, but also the limitations of
each method. We will illustrate, through examples, the
unique role that magnetostratigraphy can play, especially in
understanding the mechanisms of climate variability, by
allowing the evaluation and possible quantification of temporal phase differences between various regions and between
different records (ocean, cryosphere, land).
Fig. 7.1 Diagram of the geocentric, inclined dipole
102
C. Laj et al.