

436
Z. Li et al.
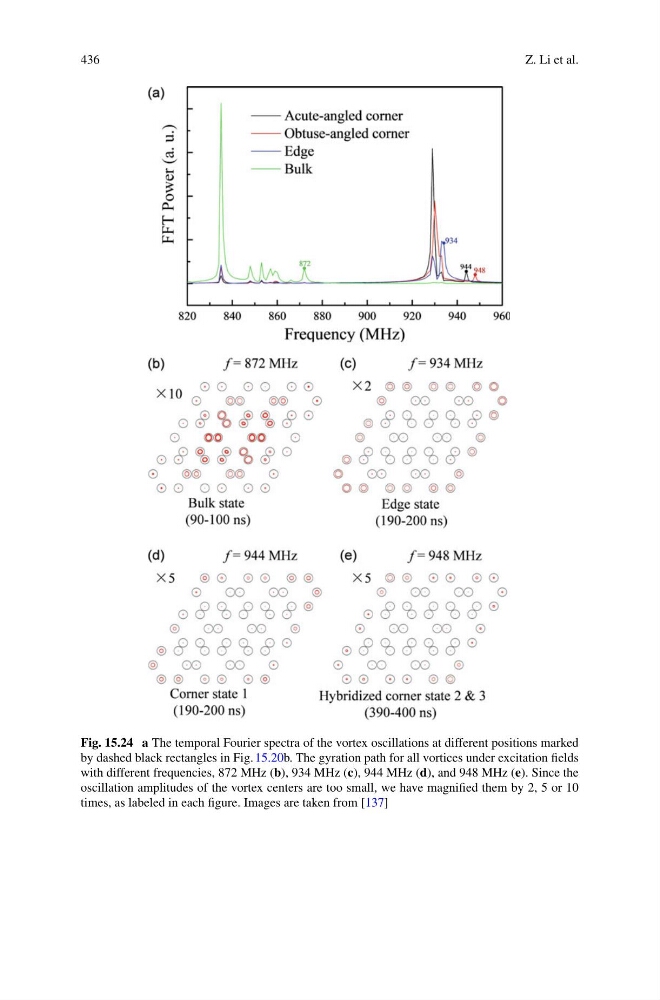
Fig. 15.24 a The temporal Fourier spectra of the vortex oscillations at different positions marked
by dashed black rectangles in Fig. 15.20b. The gyration path for all vortices under excitation fields
with different frequencies, 872 MHz (b), 934 MHz (c), 944 MHz (d), and 948 MHz (e). Since the
oscillation amplitudes of the vortex centers are too small, we have magnified them by 2, 5 or 10
times, as labeled in each figure. Images are taken from [137]
Z. Li et al.
Fig. 15.24 a The temporal Fourier spectra of the vortex oscillations at different positions marked
by dashed black rectangles in Fig. 15.20b. The gyration path for all vortices under excitation fields
with different frequencies, 872 MHz (b), 934 MHz (c), 944 MHz (d), and 948 MHz (e). Since the
oscillation amplitudes of the vortex centers are too small, we have magnified them by 2, 5 or 10
times, as labeled in each figure. Images are taken from [137]