

392
M. Hattab et al.
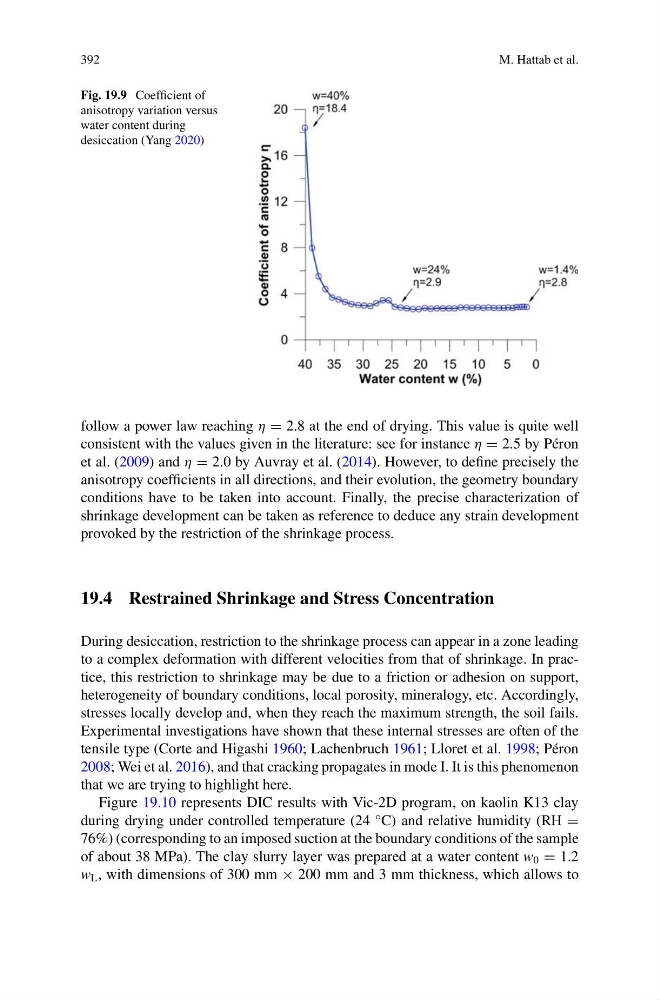
Fig. 19.9 Coefficient of
anisotropy variation versus
water content during
desiccation (Yang 2020)
follow a power law reaching η = 2.8 at the end of drying. This value is quite well
consistent with the values given in the literature: see for instance η = 2.5 by Péron
et al. (2009) and η = 2.0 by Auvray et al. (2014). However, to define precisely the
anisotropy coefficients in all directions, and their evolution, the geometry boundary
conditions have to be taken into account. Finally, the precise characterization of
shrinkage development can be taken as reference to deduce any strain development
provoked by the restriction of the shrinkage process.
19.4 Restrained Shrinkage and Stress Concentration
During desiccation, restriction to the shrinkage process can appear in a zone leading
to a complex deformation with different velocities from that of shrinkage. In practice, this restriction to shrinkage may be due to a friction or adhesion on support,
heterogeneity of boundary conditions, local porosity, mineralogy, etc. Accordingly,
stresses locally develop and, when they reach the maximum strength, the soil fails.
Experimental investigations have shown that these internal stresses are often of the
tensile type (Corte and Higashi 1960; Lachenbruch 1961; Lloret et al. 1998; Péron
2008; Wei et al. 2016), and that cracking propagates in mode I. It is this phenomenon
that we are trying to highlight here.
Figure 19.10 represents DIC results with Vic-2D program, on kaolin K13 clay
during drying under controlled temperature (24 °C) and relative humidity (RH =
76%) (corresponding to an imposed suction at the boundary conditions of the sample
of about 38 MPa). The clay slurry layer was prepared at a water content w 0 = 1.2
w L , with dimensions of 300 mm × 200 mm and 3 mm thickness, which allows to
M. Hattab et al.
Fig. 19.9 Coefficient of
anisotropy variation versus
water content during
desiccation (Yang 2020)
follow a power law reaching η = 2.8 at the end of drying. This value is quite well
consistent with the values given in the literature: see for instance η = 2.5 by Péron
et al. (2009) and η = 2.0 by Auvray et al. (2014). However, to define precisely the
anisotropy coefficients in all directions, and their evolution, the geometry boundary
conditions have to be taken into account. Finally, the precise characterization of
shrinkage development can be taken as reference to deduce any strain development
provoked by the restriction of the shrinkage process.
19.4 Restrained Shrinkage and Stress Concentration
During desiccation, restriction to the shrinkage process can appear in a zone leading
to a complex deformation with different velocities from that of shrinkage. In practice, this restriction to shrinkage may be due to a friction or adhesion on support,
heterogeneity of boundary conditions, local porosity, mineralogy, etc. Accordingly,
stresses locally develop and, when they reach the maximum strength, the soil fails.
Experimental investigations have shown that these internal stresses are often of the
tensile type (Corte and Higashi 1960; Lachenbruch 1961; Lloret et al. 1998; Péron
2008; Wei et al. 2016), and that cracking propagates in mode I. It is this phenomenon
that we are trying to highlight here.
Figure 19.10 represents DIC results with Vic-2D program, on kaolin K13 clay
during drying under controlled temperature (24 °C) and relative humidity (RH =
76%) (corresponding to an imposed suction at the boundary conditions of the sample
of about 38 MPa). The clay slurry layer was prepared at a water content w 0 = 1.2
w L , with dimensions of 300 mm × 200 mm and 3 mm thickness, which allows to