

390
M. Hattab et al.
0 1 2 cm
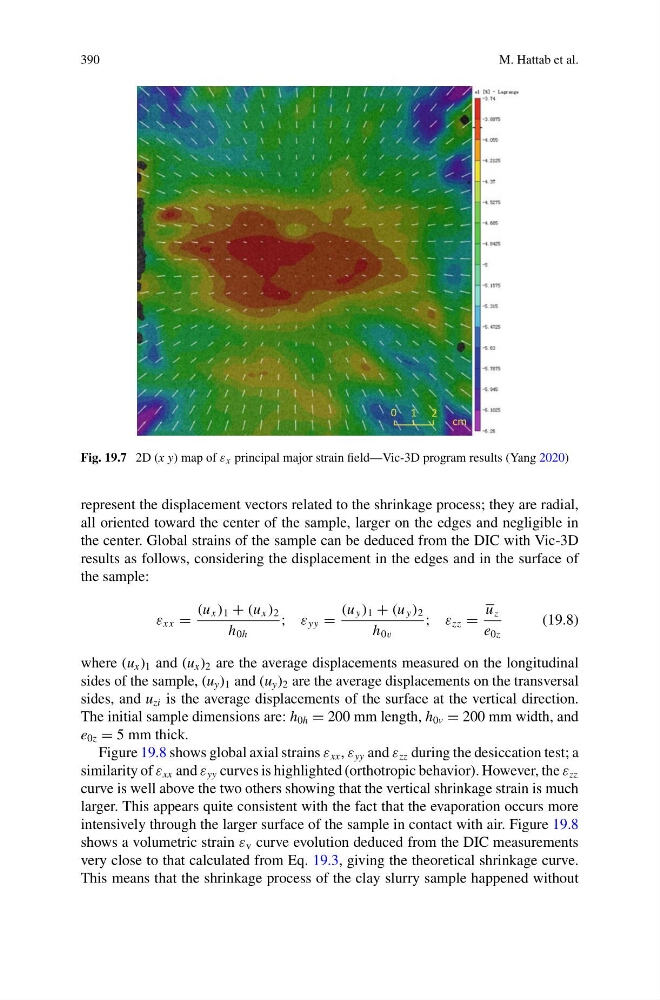
Fig. 19.7 2D (x y) map of ε x principal major strain field—Vic-3D program results (Yang 2020)
represent the displacement vectors related to the shrinkage process; they are radial,
all oriented toward the center of the sample, larger on the edges and negligible in
the center. Global strains of the sample can be deduced from the DIC with Vic-3D
results as follows, considering the displacement in the edges and in the surface of
the sample:
ε xx =
(u x ) 1 + (u x ) 2
h 0h
; ε yy =
(u y ) 1 + (u y ) 2
h 0v
; ε zz =
u z
e 0z
(19.8)
where (u x ) 1 and (u x ) 2 are the average displacements measured on the longitudinal
sides of the sample, (u y ) 1 and (u y ) 2 are the average displacements on the transversal
sides, and u zi is the average displacements of the surface at the vertical direction.
The initial sample dimensions are: h 0h = 200 mm length, h 0v = 200 mm width, and
e 0z = 5 mm thick.
Figure 19.8 shows global axial strains ε xx , ε yy and ε zz during the desiccation test; a
similarity of ε xx and ε yy curves is highlighted (orthotropic behavior). However, the ε zz
curve is well above the two others showing that the vertical shrinkage strain is much
larger. This appears quite consistent with the fact that the evaporation occurs more
intensively through the larger surface of the sample in contact with air. Figure 19.8
shows a volumetric strain ε v curve evolution deduced from the DIC measurements
very close to that calculated from Eq. 19.3, giving the theoretical shrinkage curve.
This means that the shrinkage process of the clay slurry sample happened without
M. Hattab et al.
0 1 2 cm
Fig. 19.7 2D (x y) map of ε x principal major strain field—Vic-3D program results (Yang 2020)
represent the displacement vectors related to the shrinkage process; they are radial,
all oriented toward the center of the sample, larger on the edges and negligible in
the center. Global strains of the sample can be deduced from the DIC with Vic-3D
results as follows, considering the displacement in the edges and in the surface of
the sample:
ε xx =
(u x ) 1 + (u x ) 2
h 0h
; ε yy =
(u y ) 1 + (u y ) 2
h 0v
; ε zz =
u z
e 0z
(19.8)
where (u x ) 1 and (u x ) 2 are the average displacements measured on the longitudinal
sides of the sample, (u y ) 1 and (u y ) 2 are the average displacements on the transversal
sides, and u zi is the average displacements of the surface at the vertical direction.
The initial sample dimensions are: h 0h = 200 mm length, h 0v = 200 mm width, and
e 0z = 5 mm thick.
Figure 19.8 shows global axial strains ε xx , ε yy and ε zz during the desiccation test; a
similarity of ε xx and ε yy curves is highlighted (orthotropic behavior). However, the ε zz
curve is well above the two others showing that the vertical shrinkage strain is much
larger. This appears quite consistent with the fact that the evaporation occurs more
intensively through the larger surface of the sample in contact with air. Figure 19.8
shows a volumetric strain ε v curve evolution deduced from the DIC measurements
very close to that calculated from Eq. 19.3, giving the theoretical shrinkage curve.
This means that the shrinkage process of the clay slurry sample happened without