

10
I. A. Volkov et al.
Fig. 1.3 The history of the loading at block proportional and non-proportional deformation
• the third block includes 50 loading cycles with the amplitude of σ 11 = 248 MPa
and average stress σ
aver
11 = 78 MPa.
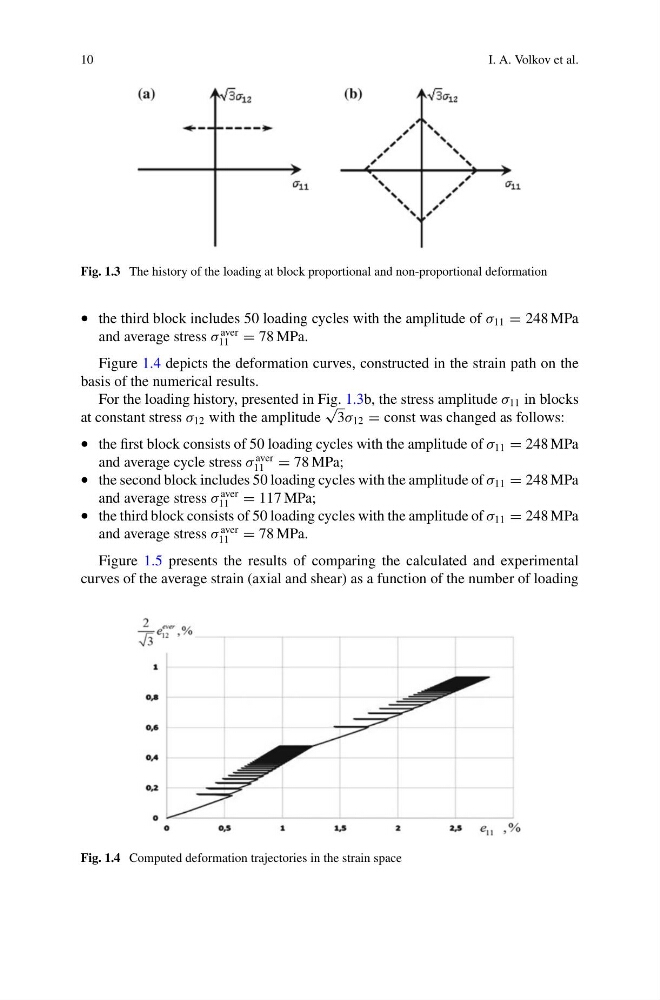
Figure 1.4 depicts the deformation curves, constructed in the strain path on the
basis of the numerical results.
For the loading history, presented in Fig. 1.3b, the stress amplitude σ 11 in blocks
at constant stress σ 12 with the amplitude
√
3σ 12 = const was changed as follows:
• the first block consists of 50 loading cycles with the amplitude of σ 11 = 248 MPa
and average cycle stress σ
aver
11 = 78 MPa;
• the second block includes 50 loading cycles with the amplitude of σ 11 = 248 MPa
and average stress σ
aver
11 = 117 MPa;
• the third block consists of 50 loading cycles with the amplitude of σ 11 = 248 MPa
and average stress σ
aver
11 = 78 MPa.
Figure 1.5 presents the results of comparing the calculated and experimental
curves of the average strain (axial and shear) as a function of the number of loading
Fig. 1.4 Computed deformation trajectories in the strain space
I. A. Volkov et al.
Fig. 1.3 The history of the loading at block proportional and non-proportional deformation
• the third block includes 50 loading cycles with the amplitude of σ 11 = 248 MPa
and average stress σ
aver
11 = 78 MPa.
Figure 1.4 depicts the deformation curves, constructed in the strain path on the
basis of the numerical results.
For the loading history, presented in Fig. 1.3b, the stress amplitude σ 11 in blocks
at constant stress σ 12 with the amplitude
√
3σ 12 = const was changed as follows:
• the first block consists of 50 loading cycles with the amplitude of σ 11 = 248 MPa
and average cycle stress σ
aver
11 = 78 MPa;
• the second block includes 50 loading cycles with the amplitude of σ 11 = 248 MPa
and average stress σ
aver
11 = 117 MPa;
• the third block consists of 50 loading cycles with the amplitude of σ 11 = 248 MPa
and average stress σ
aver
11 = 78 MPa.
Figure 1.5 presents the results of comparing the calculated and experimental
curves of the average strain (axial and shear) as a function of the number of loading
Fig. 1.4 Computed deformation trajectories in the strain space