

13 High Strain Rate Tension Experiments Features …
207
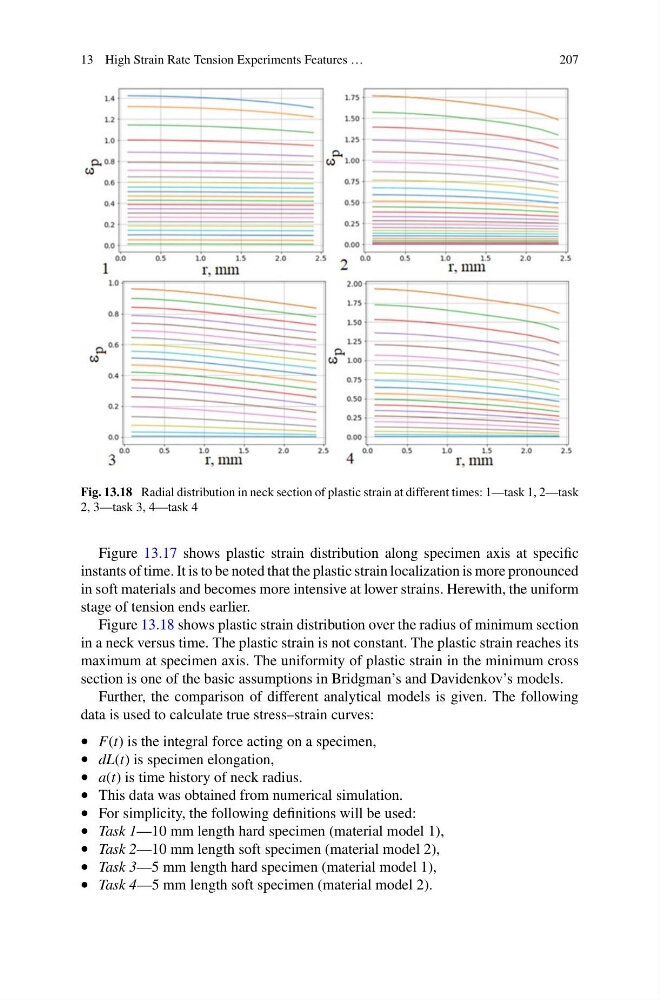
Fig. 13.18 Radial distribution in neck section of plastic strain at different times: 1—task 1, 2—task
2, 3—task 3, 4—task 4
Figure 13.17 shows plastic strain distribution along specimen axis at specific
instants of time. It is to be noted that the plastic strain localization is more pronounced
in soft materials and becomes more intensive at lower strains. Herewith, the uniform
stage of tension ends earlier.
Figure 13.18 shows plastic strain distribution over the radius of minimum section
in a neck versus time. The plastic strain is not constant. The plastic strain reaches its
maximum at specimen axis. The uniformity of plastic strain in the minimum cross
section is one of the basic assumptions in Bridgman’s and Davidenkov’s models.
Further, the comparison of different analytical models is given. The following
data is used to calculate true stress–strain curves:
• F(t) is the integral force acting on a specimen,
• dL(t) is specimen elongation,
• a(t) is time history of neck radius.
• This data was obtained from numerical simulation.
• For simplicity, the following definitions will be used:
• Task 1—10 mm length hard specimen (material model 1),
• Task 2—10 mm length soft specimen (material model 2),
• Task 3—5 mm length hard specimen (material model 1),
• Task 4—5 mm length soft specimen (material model 2).
207
Fig. 13.18 Radial distribution in neck section of plastic strain at different times: 1—task 1, 2—task
2, 3—task 3, 4—task 4
Figure 13.17 shows plastic strain distribution along specimen axis at specific
instants of time. It is to be noted that the plastic strain localization is more pronounced
in soft materials and becomes more intensive at lower strains. Herewith, the uniform
stage of tension ends earlier.
Figure 13.18 shows plastic strain distribution over the radius of minimum section
in a neck versus time. The plastic strain is not constant. The plastic strain reaches its
maximum at specimen axis. The uniformity of plastic strain in the minimum cross
section is one of the basic assumptions in Bridgman’s and Davidenkov’s models.
Further, the comparison of different analytical models is given. The following
data is used to calculate true stress–strain curves:
• F(t) is the integral force acting on a specimen,
• dL(t) is specimen elongation,
• a(t) is time history of neck radius.
• This data was obtained from numerical simulation.
• For simplicity, the following definitions will be used:
• Task 1—10 mm length hard specimen (material model 1),
• Task 2—10 mm length soft specimen (material model 2),
• Task 3—5 mm length hard specimen (material model 1),
• Task 4—5 mm length soft specimen (material model 2).