

13
measured in millimeters, meters, or even kilometers, known as radio
waves and microwaves. The range of wavelengths of radiation is vast,
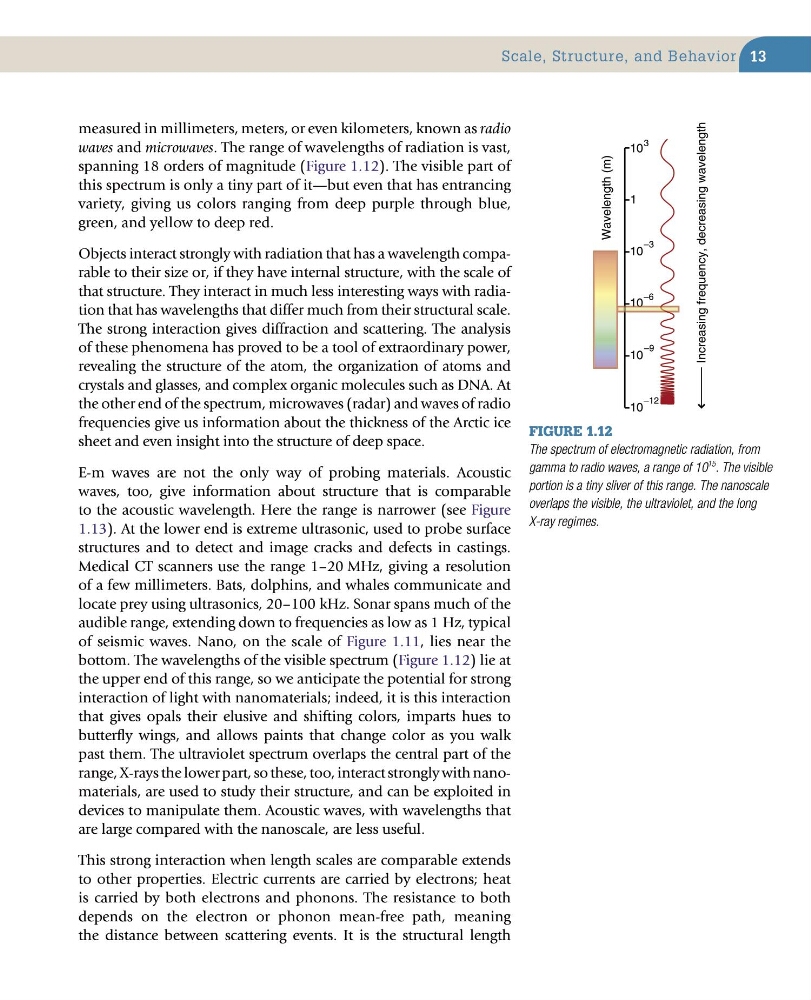
spanning 18 orders of magnitude (Figure 1.12). The visible part of
this spectrum is only a tiny part of it—but even that has entrancing
variety, giving us colors ranging from deep purple through blue,
green, and yellow to deep red.
Objects interact strongly with radiation that has a wavelength comparable to their size or, if they have internal structure, with the scale of
that structure. They interact in much less interesting ways with radiation that has wavelengths that differ much from their structural scale.
The strong interaction gives diffraction and scattering. The analysis
of these phenomena has proved to be a tool of extraordinary power,
revealing the structure of the atom, the organization of atoms and
crystals and glasses, and complex organic molecules such as DNA. At
the other end of the spectrum, microwaves (radar) and waves of radio
frequencies give us information about the thickness of the Arctic ice
sheet and even insight into the structure of deep space.
E-m waves are not the only way of probing materials. Acoustic
waves, too, give information about structure that is comparable
to the acoustic wavelength. Here the range is narrower (see Figure
1.13). At the lower end is extreme ultrasonic, used to probe surface
structures and to detect and image cracks and defects in castings.
Medical CT scanners use the range 1–20 MHz, giving a resolution
of a few millimeters. Bats, dolphins, and whales communicate and
locate prey using ultrasonics, 20–100 kHz. Sonar spans much of the
audible range, extending down to frequencies as low as 1 Hz, typical
of seismic waves. Nano, on the scale of Figure 1.11, lies near the
bottom. The wavelengths of the visible spectrum (Figure 1.12) lie at
the upper end of this range, so we anticipate the potential for strong
interaction of light with nanomaterials; indeed, it is this interaction
that gives opals their elusive and shifting colors, imparts hues to
butterfly wings, and allows paints that change color as you walk
past them. The ultraviolet spectrum overlaps the central part of the
range, X-rays the lower part, so these, too, interact strongly with nanomaterials, are used to study their structure, and can be exploited in
devices to manipulate them. Acoustic waves, with wavelengths that
are large compared with the nanoscale, are less useful.
This strong interaction when length scales are comparable extends
to other properties. Electric currents are carried by electrons; heat
is carried by both electrons and phonons. The resistance to both
depends on the electron or phonon mean-free path, meaning
the distance between scattering events. It is the structural length
Figure 1.12
The spectrum of electromagnetic radiation, from
gamma to radio waves, a range of 10
15
. The visible
portion is a tiny sliver of this range. The nanoscale
overlaps the visible, the ultraviolet, and the long
X-ray regimes.
Wavelength (m)
10
3
1
10
–3
10
–6
10
–9
10
–12
10
Increasing frequency, decreasing wavelength
Scale, Structure, and Behavior
measured in millimeters, meters, or even kilometers, known as radio
waves and microwaves. The range of wavelengths of radiation is vast,
spanning 18 orders of magnitude (Figure 1.12). The visible part of
this spectrum is only a tiny part of it—but even that has entrancing
variety, giving us colors ranging from deep purple through blue,
green, and yellow to deep red.
Objects interact strongly with radiation that has a wavelength comparable to their size or, if they have internal structure, with the scale of
that structure. They interact in much less interesting ways with radiation that has wavelengths that differ much from their structural scale.
The strong interaction gives diffraction and scattering. The analysis
of these phenomena has proved to be a tool of extraordinary power,
revealing the structure of the atom, the organization of atoms and
crystals and glasses, and complex organic molecules such as DNA. At
the other end of the spectrum, microwaves (radar) and waves of radio
frequencies give us information about the thickness of the Arctic ice
sheet and even insight into the structure of deep space.
E-m waves are not the only way of probing materials. Acoustic
waves, too, give information about structure that is comparable
to the acoustic wavelength. Here the range is narrower (see Figure
1.13). At the lower end is extreme ultrasonic, used to probe surface
structures and to detect and image cracks and defects in castings.
Medical CT scanners use the range 1–20 MHz, giving a resolution
of a few millimeters. Bats, dolphins, and whales communicate and
locate prey using ultrasonics, 20–100 kHz. Sonar spans much of the
audible range, extending down to frequencies as low as 1 Hz, typical
of seismic waves. Nano, on the scale of Figure 1.11, lies near the
bottom. The wavelengths of the visible spectrum (Figure 1.12) lie at
the upper end of this range, so we anticipate the potential for strong
interaction of light with nanomaterials; indeed, it is this interaction
that gives opals their elusive and shifting colors, imparts hues to
butterfly wings, and allows paints that change color as you walk
past them. The ultraviolet spectrum overlaps the central part of the
range, X-rays the lower part, so these, too, interact strongly with nanomaterials, are used to study their structure, and can be exploited in
devices to manipulate them. Acoustic waves, with wavelengths that
are large compared with the nanoscale, are less useful.
This strong interaction when length scales are comparable extends
to other properties. Electric currents are carried by electrons; heat
is carried by both electrons and phonons. The resistance to both
depends on the electron or phonon mean-free path, meaning
the distance between scattering events. It is the structural length
Figure 1.12
The spectrum of electromagnetic radiation, from
gamma to radio waves, a range of 10
15
. The visible
portion is a tiny sliver of this range. The nanoscale
overlaps the visible, the ultraviolet, and the long
X-ray regimes.
Wavelength (m)
10
3
1
10
–3
10
–6
10
–9
10
–12
10
Increasing frequency, decreasing wavelength
Scale, Structure, and Behavior