

9.5 Fuel Retention in Tungsten (W)
177
9.5.2 Fluence Dependence of H Retention in W
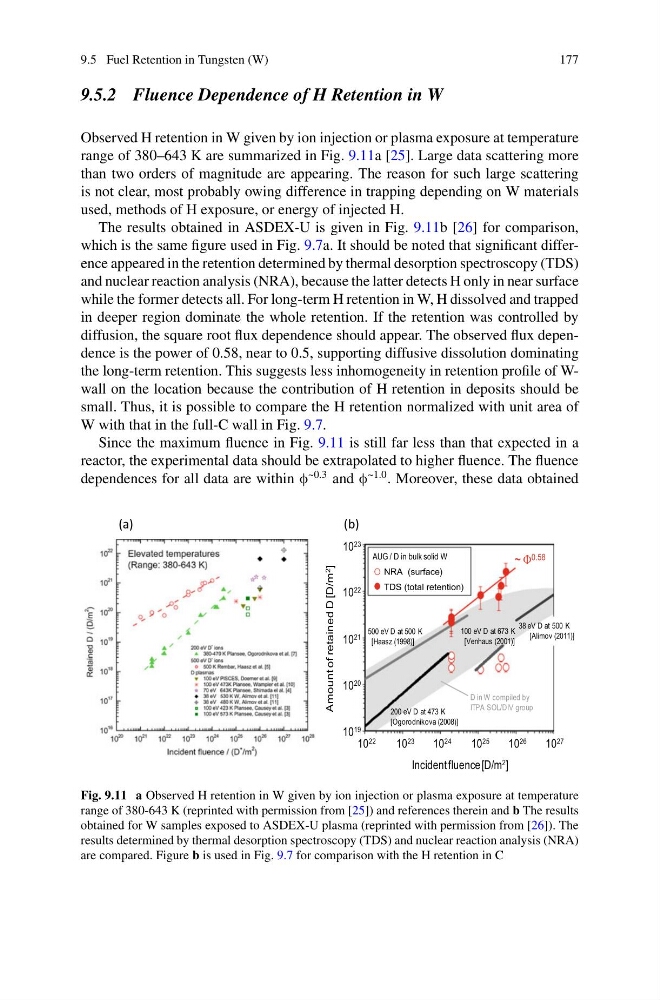
Observed H retention in W given by ion injection or plasma exposure at temperature
range of 380–643 K are summarized in Fig. 9.11a [25]. Large data scattering more
than two orders of magnitude are appearing. The reason for such large scattering
is not clear, most probably owing difference in trapping depending on W materials
used, methods of H exposure, or energy of injected H.
The results obtained in ASDEX-U is given in Fig. 9.11b [26] for comparison,
which is the same figure used in Fig. 9.7a. It should be noted that significant difference appeared in the retention determined by thermal desorption spectroscopy (TDS)
and nuclear reaction analysis (NRA), because the latter detects H only in near surface
while the former detects all. For long-term H retention in W, H dissolved and trapped
in deeper region dominate the whole retention. If the retention was controlled by
diffusion, the square root flux dependence should appear. The observed flux dependence is the power of 0.58, near to 0.5, supporting diffusive dissolution dominating
the long-term retention. This suggests less inhomogeneity in retention profile of Wwall on the location because the contribution of H retention in deposits should be
small. Thus, it is possible to compare the H retention normalized with unit area of
W with that in the full-C wall in Fig. 9.7.
Since the maximum fluence in Fig. 9.11 is still far less than that expected in a
reactor, the experimental data should be extrapolated to higher fluence. The fluence
dependences for all data are within φ
~0.3 and φ
~1.0 . Moreover, these data obtained
10
22
10
23
10
24
10
25
10
26
10
27
10
20
10
19
10 21
10 22
10
23
Incident fluence [D/m 2 ]
Amount of retained D [D/m 2
]
AUG / D in bulk solid W
NRA (surface)
TDS (total retention)
100 eV D at 673 K
[Venhaus (2001)]
200 eV D at 473 K
[Ogorodnikova (2008)]
500 eV D at 500 K
[Haasz (1998)]
38 eV D at 500 K
[Alimov (2011)]
D in W compiled by
ITPA SOL/DIV group
~ 0.58
(a)
(b)
Fig. 9.11 a Observed H retention in W given by ion injection or plasma exposure at temperature
range of 380-643 K (reprinted with permission from [25]) and references therein and b The results
obtained for W samples exposed to ASDEX-U plasma (reprinted with permission from [26]). The
results determined by thermal desorption spectroscopy (TDS) and nuclear reaction analysis (NRA)
are compared. Figure b is used in Fig. 9.7 for comparison with the H retention in C
177
9.5.2 Fluence Dependence of H Retention in W
Observed H retention in W given by ion injection or plasma exposure at temperature
range of 380–643 K are summarized in Fig. 9.11a [25]. Large data scattering more
than two orders of magnitude are appearing. The reason for such large scattering
is not clear, most probably owing difference in trapping depending on W materials
used, methods of H exposure, or energy of injected H.
The results obtained in ASDEX-U is given in Fig. 9.11b [26] for comparison,
which is the same figure used in Fig. 9.7a. It should be noted that significant difference appeared in the retention determined by thermal desorption spectroscopy (TDS)
and nuclear reaction analysis (NRA), because the latter detects H only in near surface
while the former detects all. For long-term H retention in W, H dissolved and trapped
in deeper region dominate the whole retention. If the retention was controlled by
diffusion, the square root flux dependence should appear. The observed flux dependence is the power of 0.58, near to 0.5, supporting diffusive dissolution dominating
the long-term retention. This suggests less inhomogeneity in retention profile of Wwall on the location because the contribution of H retention in deposits should be
small. Thus, it is possible to compare the H retention normalized with unit area of
W with that in the full-C wall in Fig. 9.7.
Since the maximum fluence in Fig. 9.11 is still far less than that expected in a
reactor, the experimental data should be extrapolated to higher fluence. The fluence
dependences for all data are within φ
~0.3 and φ
~1.0 . Moreover, these data obtained
10
22
10
23
10
24
10
25
10
26
10
27
10
20
10
19
10 21
10 22
10
23
Incident fluence [D/m 2 ]
Amount of retained D [D/m 2
]
AUG / D in bulk solid W
NRA (surface)
TDS (total retention)
100 eV D at 673 K
[Venhaus (2001)]
200 eV D at 473 K
[Ogorodnikova (2008)]
500 eV D at 500 K
[Haasz (1998)]
38 eV D at 500 K
[Alimov (2011)]
D in W compiled by
ITPA SOL/DIV group
~ 0.58
(a)
(b)
Fig. 9.11 a Observed H retention in W given by ion injection or plasma exposure at temperature
range of 380-643 K (reprinted with permission from [25]) and references therein and b The results
obtained for W samples exposed to ASDEX-U plasma (reprinted with permission from [26]). The
results determined by thermal desorption spectroscopy (TDS) and nuclear reaction analysis (NRA)
are compared. Figure b is used in Fig. 9.7 for comparison with the H retention in C