

140
8 PMI in Large Tokamaks
section. For the C-wall, large database on erosion and deposition is available and
details of local erosion and deposition in C-wall machines were described in Sect. 5.2
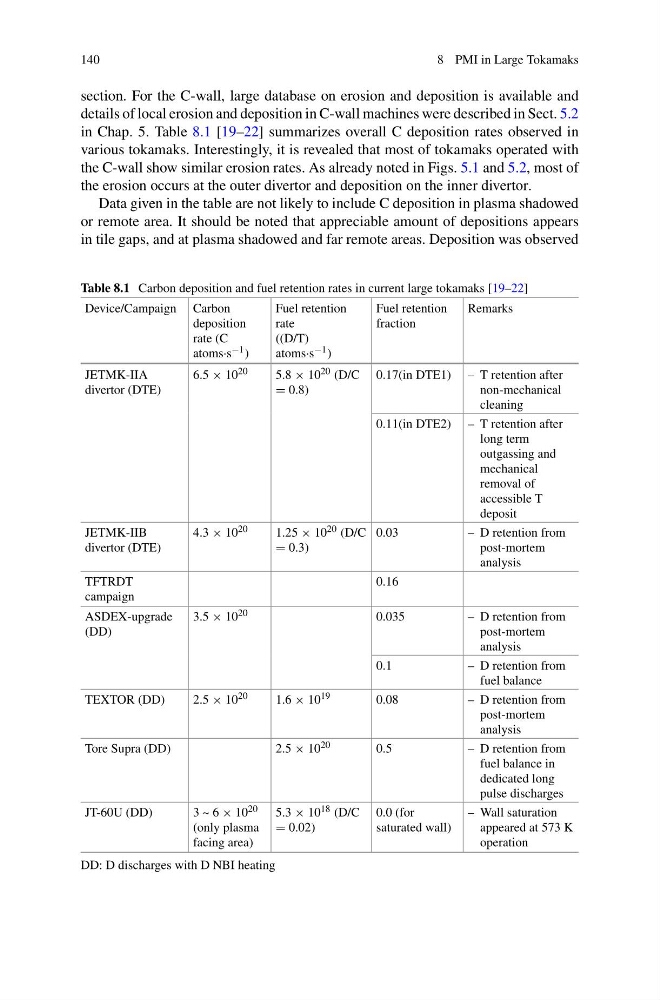
in Chap. 5. Table 8.1 [19–22] summarizes overall C deposition rates observed in
various tokamaks. Interestingly, it is revealed that most of tokamaks operated with
the C-wall show similar erosion rates. As already noted in Figs. 5.1 and 5.2, most of
the erosion occurs at the outer divertor and deposition on the inner divertor.
Data given in the table are not likely to include C deposition in plasma shadowed
or remote area. It should be noted that appreciable amount of depositions appears
in tile gaps, and at plasma shadowed and far remote areas. Deposition was observed
Table 8.1 Carbon deposition and fuel retention rates in current large tokamaks [19–22]
Device/Campaign Carbon
deposition
rate (C
atoms·s −1 )
Fuel retention
rate
((D/T)
atoms·s −1 )
Fuel retention
fraction
Remarks
JETMK-IIA
divertor (DTE)
6.5 × 10 20
5.8 × 10 20 (D/C
= 0.8)
0.17(in DTE1) – T retention after
non-mechanical
cleaning
0.11(in DTE2) – T retention after
long term
outgassing and
mechanical
removal of
accessible T
deposit
JETMK-IIB
divertor (DTE)
4.3 × 10 20
1.25 × 10 20 (D/C
= 0.3)
0.03
– D retention from
post-mortem
analysis
TFTRDT
campaign
0.16
ASDEX-upgrade
(DD)
3.5 × 10 20
0.035
– D retention from
post-mortem
analysis
0.1
– D retention from
fuel balance
TEXTOR (DD)
2.5 × 10 20
1.6 × 10 19
0.08
– D retention from
post-mortem
analysis
Tore Supra (DD)
2.5 × 10 20
0.5
– D retention from
fuel balance in
dedicated long
pulse discharges
JT-60U (DD)
3 ~ 6 × 10 20
(only plasma
facing area)
5.3 × 10 18 (D/C
= 0.02)
0.0 (for
saturated wall)
– Wall saturation
appeared at 573 K
operation
DD: D discharges with D NBI heating
8 PMI in Large Tokamaks
section. For the C-wall, large database on erosion and deposition is available and
details of local erosion and deposition in C-wall machines were described in Sect. 5.2
in Chap. 5. Table 8.1 [19–22] summarizes overall C deposition rates observed in
various tokamaks. Interestingly, it is revealed that most of tokamaks operated with
the C-wall show similar erosion rates. As already noted in Figs. 5.1 and 5.2, most of
the erosion occurs at the outer divertor and deposition on the inner divertor.
Data given in the table are not likely to include C deposition in plasma shadowed
or remote area. It should be noted that appreciable amount of depositions appears
in tile gaps, and at plasma shadowed and far remote areas. Deposition was observed
Table 8.1 Carbon deposition and fuel retention rates in current large tokamaks [19–22]
Device/Campaign Carbon
deposition
rate (C
atoms·s −1 )
Fuel retention
rate
((D/T)
atoms·s −1 )
Fuel retention
fraction
Remarks
JETMK-IIA
divertor (DTE)
6.5 × 10 20
5.8 × 10 20 (D/C
= 0.8)
0.17(in DTE1) – T retention after
non-mechanical
cleaning
0.11(in DTE2) – T retention after
long term
outgassing and
mechanical
removal of
accessible T
deposit
JETMK-IIB
divertor (DTE)
4.3 × 10 20
1.25 × 10 20 (D/C
= 0.3)
0.03
– D retention from
post-mortem
analysis
TFTRDT
campaign
0.16
ASDEX-upgrade
(DD)
3.5 × 10 20
0.035
– D retention from
post-mortem
analysis
0.1
– D retention from
fuel balance
TEXTOR (DD)
2.5 × 10 20
1.6 × 10 19
0.08
– D retention from
post-mortem
analysis
Tore Supra (DD)
2.5 × 10 20
0.5
– D retention from
fuel balance in
dedicated long
pulse discharges
JT-60U (DD)
3 ~ 6 × 10 20
(only plasma
facing area)
5.3 × 10 18 (D/C
= 0.02)
0.0 (for
saturated wall)
– Wall saturation
appeared at 573 K
operation
DD: D discharges with D NBI heating