

7.7 Long-Term Retention and Trapping
127
the static inventory. Thus, the static inventory gradually increases owing to diffusive
penetration of fuels to make isotopic replacement with impurity H and to be trapped
at defects produced by energetic particle injection including neutron.
As discussed in Chap. 3, quantitative analysis of the static T inventory in PFM
is quite hard. By integrating the difference of the T amounts between throughput
and exhaust, the dynamic T inventory of a system can be estimated. However, the
accuracy of the T measurement in gas or liquid is limited within 2 or 3 digits. This
means that the loss of 1 g T from a T handling system can hardly be detected when
1 kg of T is handled in it. Basically, the static retention can be determined by thermal
desorption after the discharge [22, 23]. However, very high temperature is required
for full recovery of T from PFM. T recovery is also required because T resource is
not enough, which is described in Chap. 8.
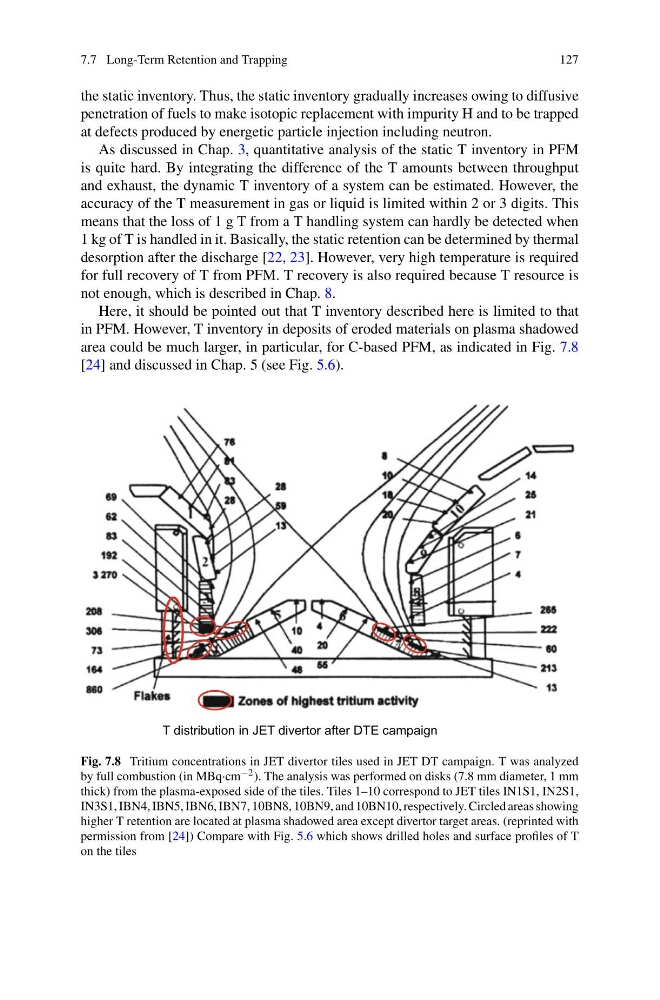
Here, it should be pointed out that T inventory described here is limited to that
in PFM. However, T inventory in deposits of eroded materials on plasma shadowed
area could be much larger, in particular, for C-based PFM, as indicated in Fig. 7.8
[24] and discussed in Chap. 5 (see Fig. 5.6).
T distribution in JET divertor after DTE campaign
Fig. 7.8 Tritium concentrations in JET divertor tiles used in JET DT campaign. T was analyzed
by full combustion (in MBq·cm −2 ). The analysis was performed on disks (7.8 mm diameter, 1 mm
thick) from the plasma-exposed side of the tiles. Tiles 1–10 correspond to JET tiles IN1S1, IN2S1,
IN3S1, IBN4, IBN5, IBN6, IBN7, 10BN8, 10BN9, and 10BN10, respectively. Circled areas showing
higher T retention are located at plasma shadowed area except divertor target areas. (reprinted with
permission from [24]) Compare with Fig. 5.6 which shows drilled holes and surface profiles of T
on the tiles
127
the static inventory. Thus, the static inventory gradually increases owing to diffusive
penetration of fuels to make isotopic replacement with impurity H and to be trapped
at defects produced by energetic particle injection including neutron.
As discussed in Chap. 3, quantitative analysis of the static T inventory in PFM
is quite hard. By integrating the difference of the T amounts between throughput
and exhaust, the dynamic T inventory of a system can be estimated. However, the
accuracy of the T measurement in gas or liquid is limited within 2 or 3 digits. This
means that the loss of 1 g T from a T handling system can hardly be detected when
1 kg of T is handled in it. Basically, the static retention can be determined by thermal
desorption after the discharge [22, 23]. However, very high temperature is required
for full recovery of T from PFM. T recovery is also required because T resource is
not enough, which is described in Chap. 8.
Here, it should be pointed out that T inventory described here is limited to that
in PFM. However, T inventory in deposits of eroded materials on plasma shadowed
area could be much larger, in particular, for C-based PFM, as indicated in Fig. 7.8
[24] and discussed in Chap. 5 (see Fig. 5.6).
T distribution in JET divertor after DTE campaign
Fig. 7.8 Tritium concentrations in JET divertor tiles used in JET DT campaign. T was analyzed
by full combustion (in MBq·cm −2 ). The analysis was performed on disks (7.8 mm diameter, 1 mm
thick) from the plasma-exposed side of the tiles. Tiles 1–10 correspond to JET tiles IN1S1, IN2S1,
IN3S1, IBN4, IBN5, IBN6, IBN7, 10BN8, 10BN9, and 10BN10, respectively. Circled areas showing
higher T retention are located at plasma shadowed area except divertor target areas. (reprinted with
permission from [24]) Compare with Fig. 5.6 which shows drilled holes and surface profiles of T
on the tiles