

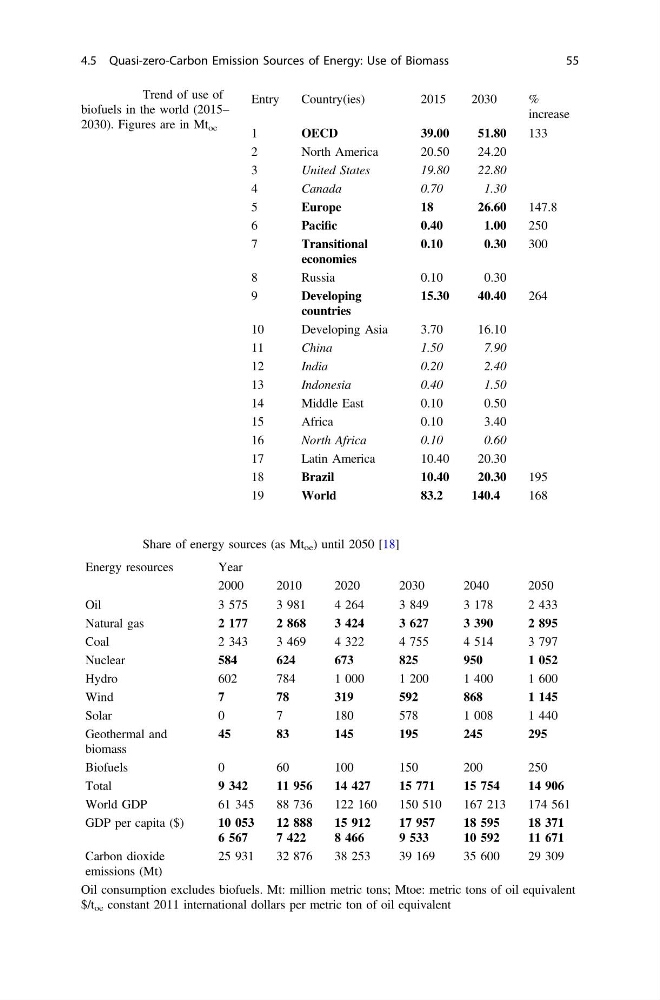
Table 4.2 Trend of use of
biofuels in the world (2015–
2030). Figures are in Mt oe
Entry
Country(ies)
2015
2030
%
increase
1
OECD
39.00
51.80
133
2
North America
20.50
24.20
3
United States
19.80
22.80
4
Canada
0.70
1.30
5
Europe
18
26.60
147.8
6
Pacific
0.40
1.00
250
7
Transitional
economies
0.10
0.30
300
8
Russia
0.10
0.30
9
Developing
countries
15.30
40.40
264
10
Developing Asia
3.70
16.10
11
China
1.50
7.90
12
India
0.20
2.40
13
Indonesia
0.40
1.50
14
Middle East
0.10
0.50
15
Africa
0.10
3.40
16
North Africa
0.10
0.60
17
Latin America
10.40
20.30
18
Brazil
10.40
20.30
195
19
World
83.2
140.4
168
Table 4.3 Share of energy sources (as Mt oe ) until 2050 [18]
Energy resources
Year
2000
2010
2020
2030
2040
2050
Oil
3 575
3 981
4 264
3 849
3 178
2 433
Natural gas
2 177
2 868
3 424
3 627
3 390
2 895
Coal
2 343
3 469
4 322
4 755
4 514
3 797
Nuclear
584
624
673
825
950
1 052
Hydro
602
784
1 000
1 200
1 400
1 600
Wind
7
78
319
592
868
1 145
Solar
0
7
180
578
1 008
1 440
Geothermal and
biomass
45
83
145
195
245
295
Biofuels
0
60
100
150
200
250
Total
9 342
11 956
14 427
15 771
15 754
14 906
World GDP
61 345
88 736
122 160
150 510
167 213
174 561
GDP per capita ($)
10 053
6 567
12 888
7 422
15 912
8 466
17 957
9 533
18 595
10 592
18 371
11 671
Carbon dioxide
emissions (Mt)
25 931
32 876
38 253
39 169
35 600
29 309
Oil consumption excludes biofuels. Mt: million metric tons; Mtoe: metric tons of oil equivalent
$/t oe constant 2011 international dollars per metric ton of oil equivalent
4.5 Quasi-zero-Carbon Emission Sources of Energy: Use of Biomass
55
biofuels in the world (2015–
2030). Figures are in Mt oe
Entry
Country(ies)
2015
2030
%
increase
1
OECD
39.00
51.80
133
2
North America
20.50
24.20
3
United States
19.80
22.80
4
Canada
0.70
1.30
5
Europe
18
26.60
147.8
6
Pacific
0.40
1.00
250
7
Transitional
economies
0.10
0.30
300
8
Russia
0.10
0.30
9
Developing
countries
15.30
40.40
264
10
Developing Asia
3.70
16.10
11
China
1.50
7.90
12
India
0.20
2.40
13
Indonesia
0.40
1.50
14
Middle East
0.10
0.50
15
Africa
0.10
3.40
16
North Africa
0.10
0.60
17
Latin America
10.40
20.30
18
Brazil
10.40
20.30
195
19
World
83.2
140.4
168
Table 4.3 Share of energy sources (as Mt oe ) until 2050 [18]
Energy resources
Year
2000
2010
2020
2030
2040
2050
Oil
3 575
3 981
4 264
3 849
3 178
2 433
Natural gas
2 177
2 868
3 424
3 627
3 390
2 895
Coal
2 343
3 469
4 322
4 755
4 514
3 797
Nuclear
584
624
673
825
950
1 052
Hydro
602
784
1 000
1 200
1 400
1 600
Wind
7
78
319
592
868
1 145
Solar
0
7
180
578
1 008
1 440
Geothermal and
biomass
45
83
145
195
245
295
Biofuels
0
60
100
150
200
250
Total
9 342
11 956
14 427
15 771
15 754
14 906
World GDP
61 345
88 736
122 160
150 510
167 213
174 561
GDP per capita ($)
10 053
6 567
12 888
7 422
15 912
8 466
17 957
9 533
18 595
10 592
18 371
11 671
Carbon dioxide
emissions (Mt)
25 931
32 876
38 253
39 169
35 600
29 309
Oil consumption excludes biofuels. Mt: million metric tons; Mtoe: metric tons of oil equivalent
$/t oe constant 2011 international dollars per metric ton of oil equivalent
4.5 Quasi-zero-Carbon Emission Sources of Energy: Use of Biomass
55