

1.2 The Fossil-C-Based Energy Frame
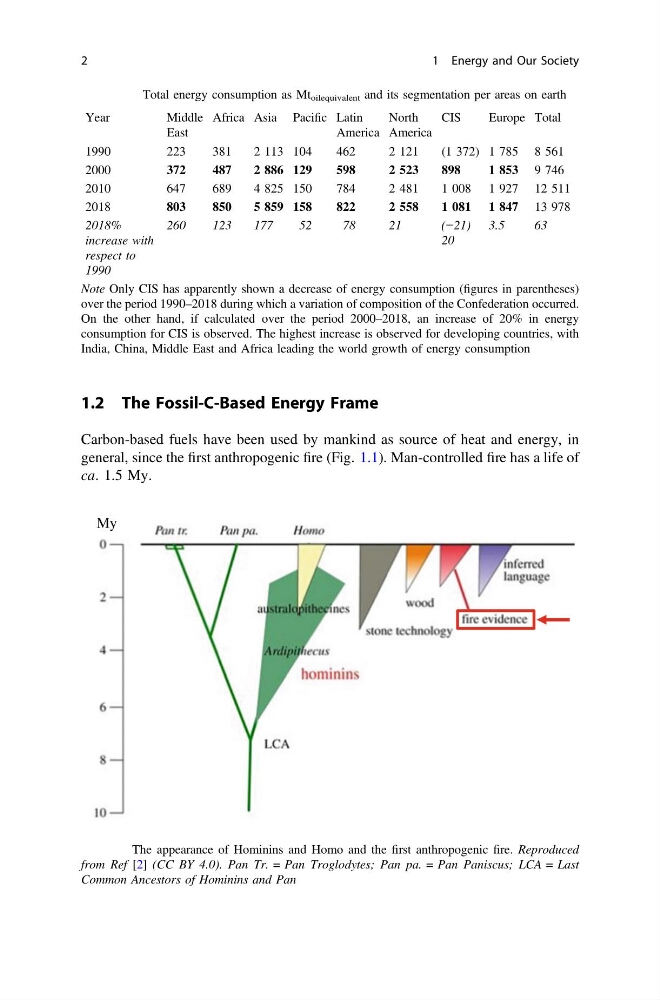
Carbon-based fuels have been used by mankind as source of heat and energy, in
general, since the first anthropogenic fire (Fig. 1.1). Man-controlled fire has a life of
ca. 1.5 My.
Table 1.1 Total energy consumption as Mt oilequivalent and its segmentation per areas on earth
Year
Middle
East
Africa Asia Pacific Latin
America
North
America
CIS
Europe Total
1990
223
381
2 113 104
462
2 121
(1 372) 1 785 8 561
2000
372
487
2 886 129
598
2 523
898
1 853 9 746
2010
647
689
4 825 150
784
2 481
1 008 1 927 12 511
2018
803
850
5 859 158
822
2 558
1 081 1 847 13 978
2018%
increase with
respect to
1990
260
123
177
52
78
21
(−21)
20
3.5
63
Note Only CIS has apparently shown a decrease of energy consumption (figures in parentheses)
over the period 1990–2018 during which a variation of composition of the Confederation occurred.
On the other hand, if calculated over the period 2000–2018, an increase of 20% in energy
consumption for CIS is observed. The highest increase is observed for developing countries, with
India, China, Middle East and Africa leading the world growth of energy consumption
My
Fig. 1.1 The appearance of Hominins and Homo and the first anthropogenic fire. Reproduced
from Ref [2] (CC BY 4.0). Pan Tr. = Pan Troglodytes; Pan pa. = Pan Paniscus; LCA = Last
Common Ancestors of Hominins and Pan
2
1 Energy and Our Society
Carbon-based fuels have been used by mankind as source of heat and energy, in
general, since the first anthropogenic fire (Fig. 1.1). Man-controlled fire has a life of
ca. 1.5 My.
Table 1.1 Total energy consumption as Mt oilequivalent and its segmentation per areas on earth
Year
Middle
East
Africa Asia Pacific Latin
America
North
America
CIS
Europe Total
1990
223
381
2 113 104
462
2 121
(1 372) 1 785 8 561
2000
372
487
2 886 129
598
2 523
898
1 853 9 746
2010
647
689
4 825 150
784
2 481
1 008 1 927 12 511
2018
803
850
5 859 158
822
2 558
1 081 1 847 13 978
2018%
increase with
respect to
1990
260
123
177
52
78
21
(−21)
20
3.5
63
Note Only CIS has apparently shown a decrease of energy consumption (figures in parentheses)
over the period 1990–2018 during which a variation of composition of the Confederation occurred.
On the other hand, if calculated over the period 2000–2018, an increase of 20% in energy
consumption for CIS is observed. The highest increase is observed for developing countries, with
India, China, Middle East and Africa leading the world growth of energy consumption
My
Fig. 1.1 The appearance of Hominins and Homo and the first anthropogenic fire. Reproduced
from Ref [2] (CC BY 4.0). Pan Tr. = Pan Troglodytes; Pan pa. = Pan Paniscus; LCA = Last
Common Ancestors of Hominins and Pan
2
1 Energy and Our Society