

94
T. Basu et al.
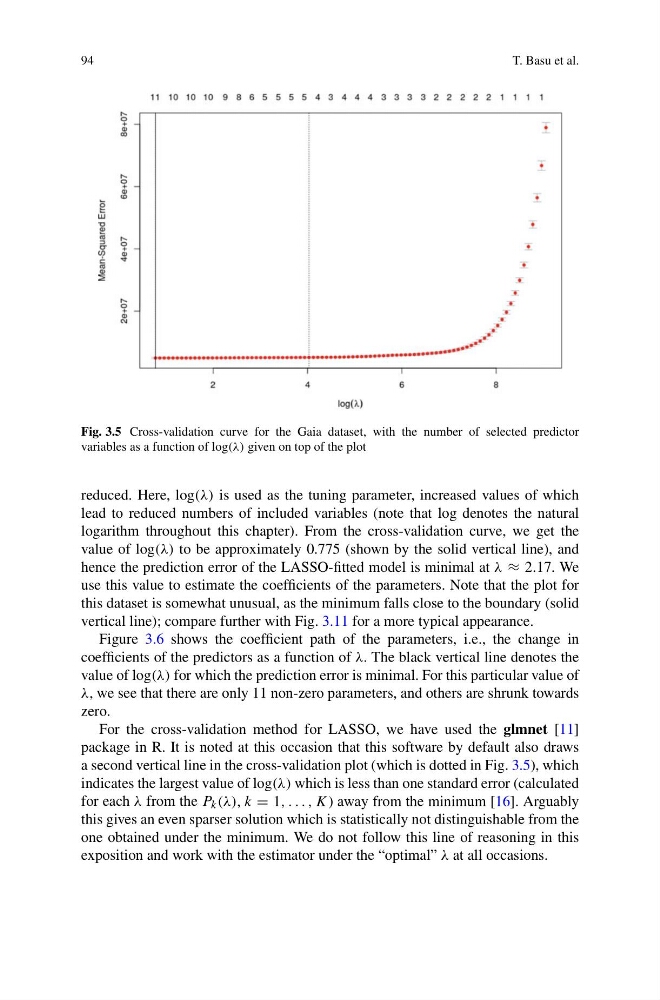
Fig. 3.5 Cross-validation curve for the Gaia dataset, with the number of selected predictor
variables as a function of log(λ) given on top of the plot
reduced. Here, log(λ) is used as the tuning parameter, increased values of which
lead to reduced numbers of included variables (note that log denotes the natural
logarithm throughout this chapter). From the cross-validation curve, we get the
value of log(λ) to be approximately 0.775 (shown by the solid vertical line), and
hence the prediction error of the LASSO-fitted model is minimal at λ ≈ 2.17. We
use this value to estimate the coefficients of the parameters. Note that the plot for
this dataset is somewhat unusual, as the minimum falls close to the boundary (solid
vertical line); compare further with Fig. 3.11 for a more typical appearance.
Figure 3.6 shows the coefficient path of the parameters, i.e., the change in
coefficients of the predictors as a function of λ. The black vertical line denotes the
value of log(λ) for which the prediction error is minimal. For this particular value of
λ, we see that there are only 11 non-zero parameters, and others are shrunk towards
zero.
For the cross-validation method for LASSO, we have used the glmnet [11]
package in R. It is noted at this occasion that this software by default also draws
a second vertical line in the cross-validation plot (which is dotted in Fig. 3.5), which
indicates the largest value of log(λ) which is less than one standard error (calculated
for each λ from the P k (λ), k = 1, . . . , K) away from the minimum [16]. Arguably
this gives an even sparser solution which is statistically not distinguishable from the
one obtained under the minimum. We do not follow this line of reasoning in this
exposition and work with the estimator under the “optimal” λ at all occasions.
T. Basu et al.
Fig. 3.5 Cross-validation curve for the Gaia dataset, with the number of selected predictor
variables as a function of log(λ) given on top of the plot
reduced. Here, log(λ) is used as the tuning parameter, increased values of which
lead to reduced numbers of included variables (note that log denotes the natural
logarithm throughout this chapter). From the cross-validation curve, we get the
value of log(λ) to be approximately 0.775 (shown by the solid vertical line), and
hence the prediction error of the LASSO-fitted model is minimal at λ ≈ 2.17. We
use this value to estimate the coefficients of the parameters. Note that the plot for
this dataset is somewhat unusual, as the minimum falls close to the boundary (solid
vertical line); compare further with Fig. 3.11 for a more typical appearance.
Figure 3.6 shows the coefficient path of the parameters, i.e., the change in
coefficients of the predictors as a function of λ. The black vertical line denotes the
value of log(λ) for which the prediction error is minimal. For this particular value of
λ, we see that there are only 11 non-zero parameters, and others are shrunk towards
zero.
For the cross-validation method for LASSO, we have used the glmnet [11]
package in R. It is noted at this occasion that this software by default also draws
a second vertical line in the cross-validation plot (which is dotted in Fig. 3.5), which
indicates the largest value of log(λ) which is less than one standard error (calculated
for each λ from the P k (λ), k = 1, . . . , K) away from the minimum [16]. Arguably
this gives an even sparser solution which is statistically not distinguishable from the
one obtained under the minimum. We do not follow this line of reasoning in this
exposition and work with the estimator under the “optimal” λ at all occasions.