

14 Best Practices for Surrogate Based Uncertainty Quantification in. . .
447
14.4.10 Robust Results
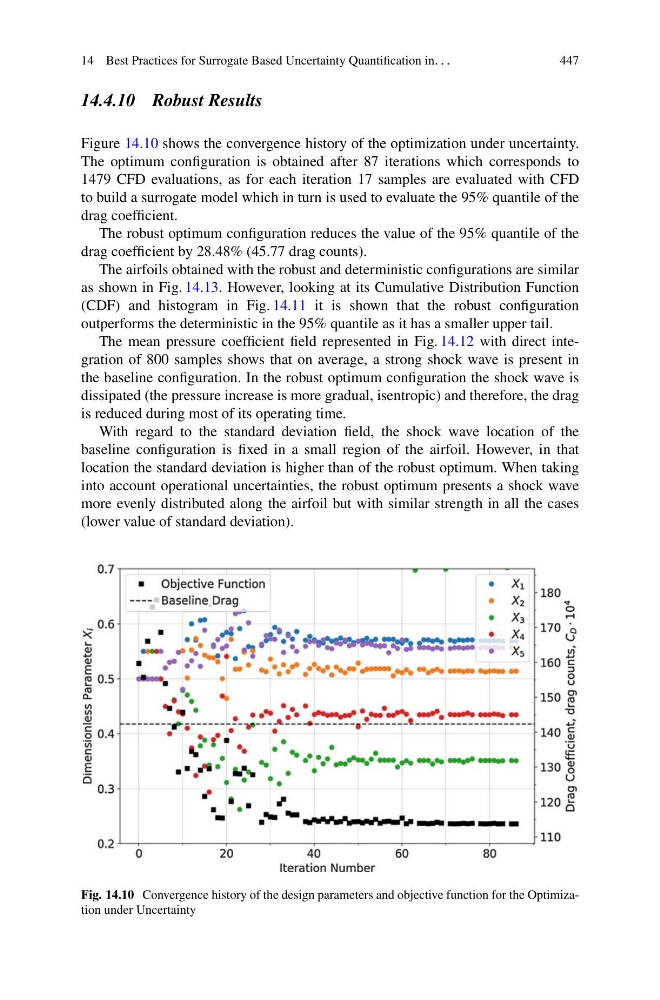
Figure 14.10 shows the convergence history of the optimization under uncertainty.
The optimum configuration is obtained after 87 iterations which corresponds to
1479 CFD evaluations, as for each iteration 17 samples are evaluated with CFD
to build a surrogate model which in turn is used to evaluate the 95% quantile of the
drag coefficient.
The robust optimum configuration reduces the value of the 95% quantile of the
drag coefficient by 28.48% (45.77 drag counts).
The airfoils obtained with the robust and deterministic configurations are similar
as shown in Fig. 14.13. However, looking at its Cumulative Distribution Function
(CDF) and histogram in Fig. 14.11 it is shown that the robust configuration
outperforms the deterministic in the 95% quantile as it has a smaller upper tail.
The mean pressure coefficient field represented in Fig. 14.12 with direct integration of 800 samples shows that on average, a strong shock wave is present in
the baseline configuration. In the robust optimum configuration the shock wave is
dissipated (the pressure increase is more gradual, isentropic) and therefore, the drag
is reduced during most of its operating time.
With regard to the standard deviation field, the shock wave location of the
baseline configuration is fixed in a small region of the airfoil. However, in that
location the standard deviation is higher than of the robust optimum. When taking
into account operational uncertainties, the robust optimum presents a shock wave
more evenly distributed along the airfoil but with similar strength in all the cases
(lower value of standard deviation).
Fig. 14.10 Convergence history of the design parameters and objective function for the Optimization under Uncertainty
447
14.4.10 Robust Results
Figure 14.10 shows the convergence history of the optimization under uncertainty.
The optimum configuration is obtained after 87 iterations which corresponds to
1479 CFD evaluations, as for each iteration 17 samples are evaluated with CFD
to build a surrogate model which in turn is used to evaluate the 95% quantile of the
drag coefficient.
The robust optimum configuration reduces the value of the 95% quantile of the
drag coefficient by 28.48% (45.77 drag counts).
The airfoils obtained with the robust and deterministic configurations are similar
as shown in Fig. 14.13. However, looking at its Cumulative Distribution Function
(CDF) and histogram in Fig. 14.11 it is shown that the robust configuration
outperforms the deterministic in the 95% quantile as it has a smaller upper tail.
The mean pressure coefficient field represented in Fig. 14.12 with direct integration of 800 samples shows that on average, a strong shock wave is present in
the baseline configuration. In the robust optimum configuration the shock wave is
dissipated (the pressure increase is more gradual, isentropic) and therefore, the drag
is reduced during most of its operating time.
With regard to the standard deviation field, the shock wave location of the
baseline configuration is fixed in a small region of the airfoil. However, in that
location the standard deviation is higher than of the robust optimum. When taking
into account operational uncertainties, the robust optimum presents a shock wave
more evenly distributed along the airfoil but with similar strength in all the cases
(lower value of standard deviation).
Fig. 14.10 Convergence history of the design parameters and objective function for the Optimization under Uncertainty