

280
D. Irawan and B. Naujoks
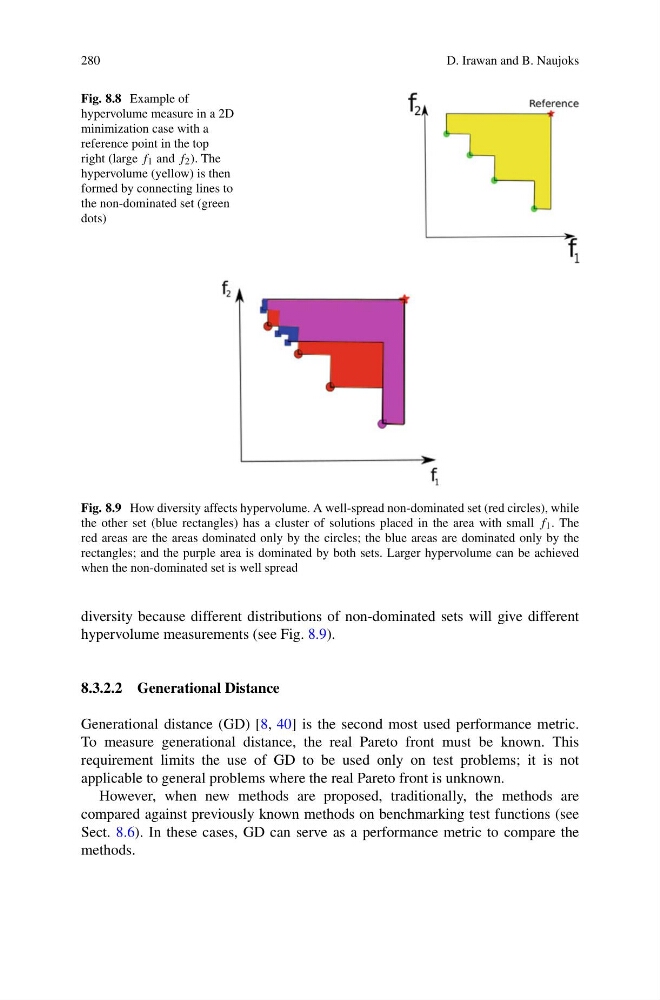
Fig. 8.8 Example of
hypervolume measure in a 2D
minimization case with a
reference point in the top
right (large f 1 and f 2 ). The
hypervolume (yellow) is then
formed by connecting lines to
the non-dominated set (green
dots)
Fig. 8.9 How diversity affects hypervolume. A well-spread non-dominated set (red circles), while
the other set (blue rectangles) has a cluster of solutions placed in the area with small f 1 . The
red areas are the areas dominated only by the circles; the blue areas are dominated only by the
rectangles; and the purple area is dominated by both sets. Larger hypervolume can be achieved
when the non-dominated set is well spread
diversity because different distributions of non-dominated sets will give different
hypervolume measurements (see Fig. 8.9).
8.3.2.2 Generational Distance
Generational distance (GD) [8, 40] is the second most used performance metric.
To measure generational distance, the real Pareto front must be known. This
requirement limits the use of GD to be used only on test problems; it is not
applicable to general problems where the real Pareto front is unknown.
However, when new methods are proposed, traditionally, the methods are
compared against previously known methods on benchmarking test functions (see
Sect. 8.6). In these cases, GD can serve as a performance metric to compare the
methods.
D. Irawan and B. Naujoks
Fig. 8.8 Example of
hypervolume measure in a 2D
minimization case with a
reference point in the top
right (large f 1 and f 2 ). The
hypervolume (yellow) is then
formed by connecting lines to
the non-dominated set (green
dots)
Fig. 8.9 How diversity affects hypervolume. A well-spread non-dominated set (red circles), while
the other set (blue rectangles) has a cluster of solutions placed in the area with small f 1 . The
red areas are the areas dominated only by the circles; the blue areas are dominated only by the
rectangles; and the purple area is dominated by both sets. Larger hypervolume can be achieved
when the non-dominated set is well spread
diversity because different distributions of non-dominated sets will give different
hypervolume measurements (see Fig. 8.9).
8.3.2.2 Generational Distance
Generational distance (GD) [8, 40] is the second most used performance metric.
To measure generational distance, the real Pareto front must be known. This
requirement limits the use of GD to be used only on test problems; it is not
applicable to general problems where the real Pareto front is unknown.
However, when new methods are proposed, traditionally, the methods are
compared against previously known methods on benchmarking test functions (see
Sect. 8.6). In these cases, GD can serve as a performance metric to compare the
methods.