

3 Uncertainty Quantification in Lasso-Type Regularization Problems
103
(serving as predictor variables) in the range 0.0–1.0. Each number represents the
energy within a particular frequency band, integrated over a certain period of time.
The label associated with each response contains the letter “R” if the object is a
rock and “M” if it is a mine (metal cylinder). There are total of 208 observations in
this dataset [17]. Here, due to computational limitations, we have taken the first 48
predictors of the Sonar dataset and used the standardized form to handle numerical
scaling issues, throughout the examples.
3.5.1.1 Cross-Validation
We apply cross-validation onto the Sonar dataset and investigate the achieved
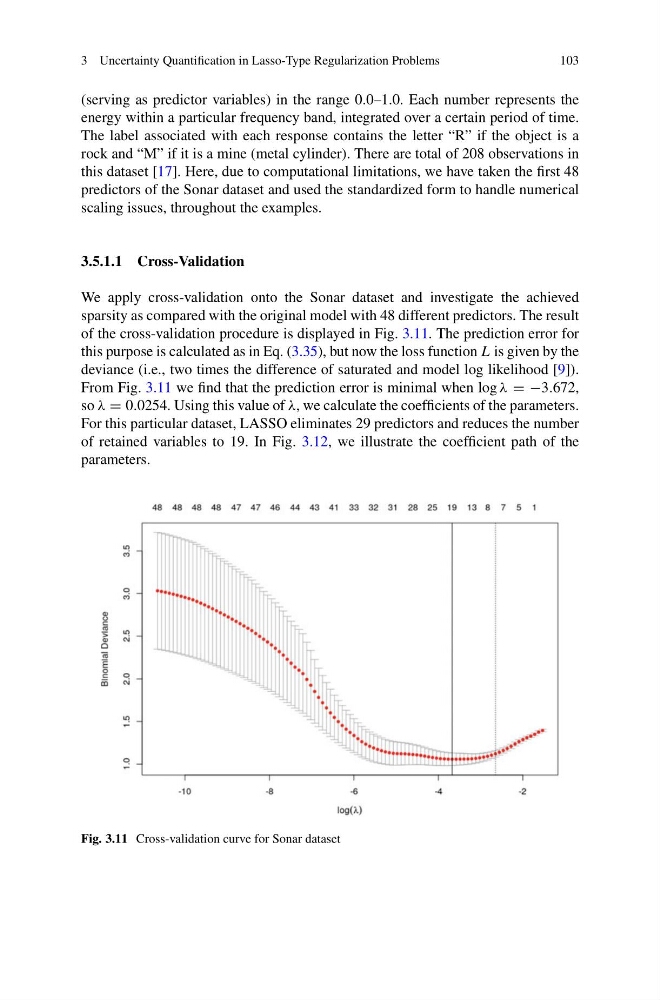
sparsity as compared with the original model with 48 different predictors. The result
of the cross-validation procedure is displayed in Fig. 3.11. The prediction error for
this purpose is calculated as in Eq. (3.35), but now the loss function L is given by the
deviance (i.e., two times the difference of saturated and model log likelihood [9]).
From Fig. 3.11 we find that the prediction error is minimal when log λ = −3.672,
so λ = 0.0254. Using this value of λ, we calculate the coefficients of the parameters.
For this particular dataset, LASSO eliminates 29 predictors and reduces the number
of retained variables to 19. In Fig. 3.12, we illustrate the coefficient path of the
parameters.
Fig. 3.11 Cross-validation curve for Sonar dataset
103
(serving as predictor variables) in the range 0.0–1.0. Each number represents the
energy within a particular frequency band, integrated over a certain period of time.
The label associated with each response contains the letter “R” if the object is a
rock and “M” if it is a mine (metal cylinder). There are total of 208 observations in
this dataset [17]. Here, due to computational limitations, we have taken the first 48
predictors of the Sonar dataset and used the standardized form to handle numerical
scaling issues, throughout the examples.
3.5.1.1 Cross-Validation
We apply cross-validation onto the Sonar dataset and investigate the achieved
sparsity as compared with the original model with 48 different predictors. The result
of the cross-validation procedure is displayed in Fig. 3.11. The prediction error for
this purpose is calculated as in Eq. (3.35), but now the loss function L is given by the
deviance (i.e., two times the difference of saturated and model log likelihood [9]).
From Fig. 3.11 we find that the prediction error is minimal when log λ = −3.672,
so λ = 0.0254. Using this value of λ, we calculate the coefficients of the parameters.
For this particular dataset, LASSO eliminates 29 predictors and reduces the number
of retained variables to 19. In Fig. 3.12, we illustrate the coefficient path of the
parameters.
Fig. 3.11 Cross-validation curve for Sonar dataset