

42 Dynamic Simulation of Woody Biomass Co-generation System …
643
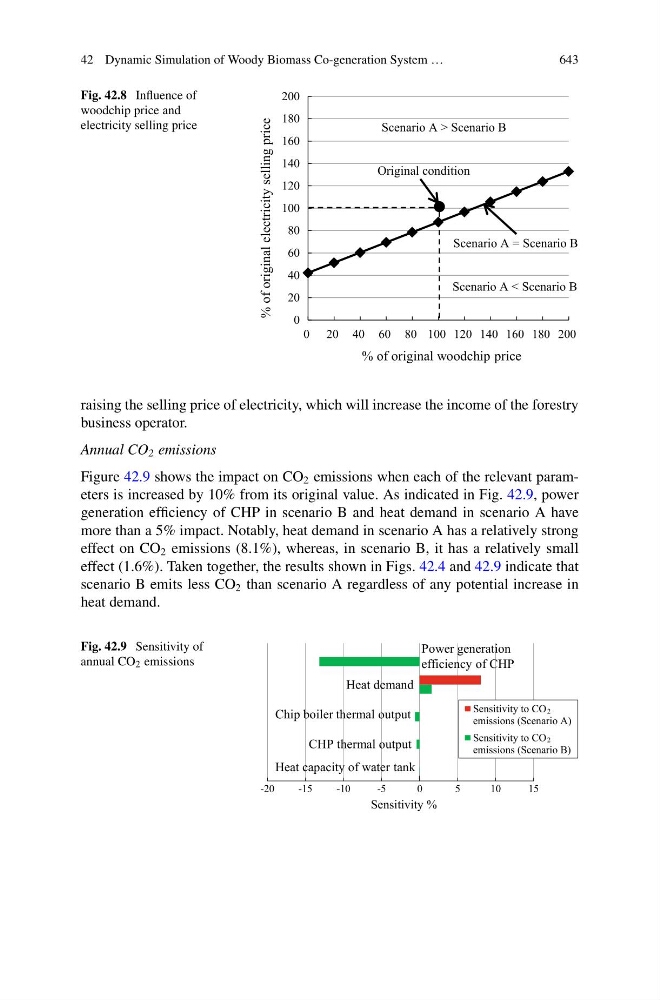
Fig. 42.8 Influence of
woodchip price and
electricity selling price
0
20
40
60
80
100
120
140
160
180
200
0 20 40 60 80 100 120 140 160 180 200
% of original woodchip price
Scenario A = Scenario B
Scenario A < Scenario B
Scenario A > Scenario B
Original condition
% of original electricity selling price
raising the selling price of electricity, which will increase the income of the forestry
business operator.
Annual CO 2 emissions
Figure 42.9 shows the impact on CO 2 emissions when each of the relevant parameters is increased by 10% from its original value. As indicated in Fig. 42.9, power
generation efficiency of CHP in scenario B and heat demand in scenario A have
more than a 5% impact. Notably, heat demand in scenario A has a relatively strong
effect on CO 2 emissions (8.1%), whereas, in scenario B, it has a relatively small
effect (1.6%). Taken together, the results shown in Figs. 42.4 and 42.9 indicate that
scenario B emits less CO 2 than scenario A regardless of any potential increase in
heat demand.
Fig. 42.9 Sensitivity of
annual CO 2 emissions
-20
-15
-10
-5
0
5
10
15
Sensitivity to CO
emissions (Scenario A)
Sensitivity to CO
emissions (Scenario B)
Power generation
efficiency of CHP
Heat demand
CHP thermal output
Chip boiler thermal output
Heat capacity of water tank
Sensitivity %
2
2