

554
I. Ihara et al.
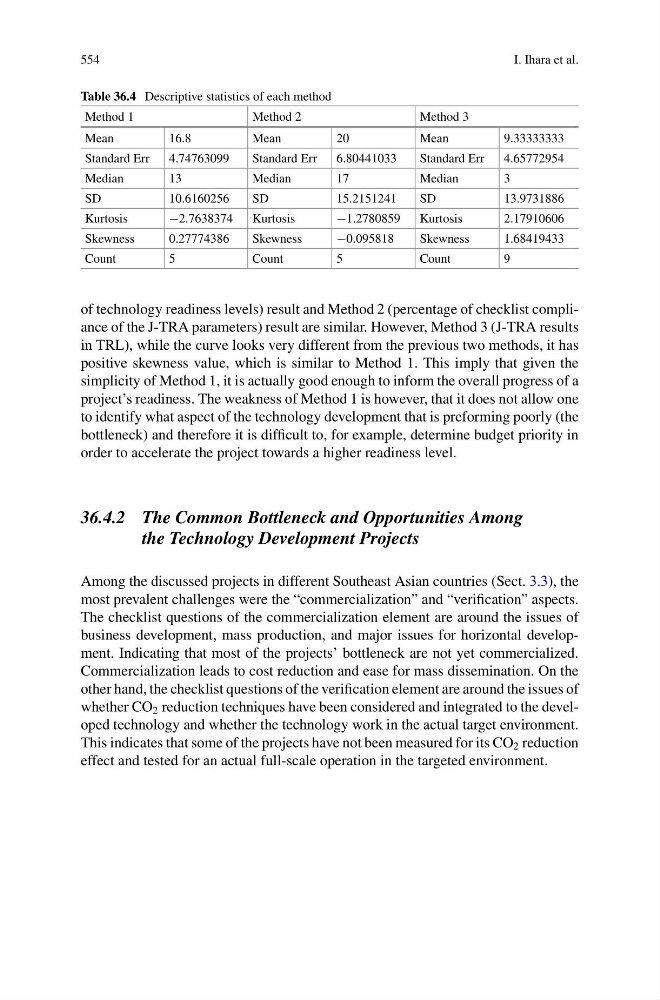
Table 36.4 Descriptive statistics of each method
Method 1
Method 2
Method 3
Mean
16.8
Mean
20
Mean
9.33333333
Standard Err
4.74763099
Standard Err
6.80441033
Standard Err
4.65772954
Median
13
Median
17
Median
3
SD
10.6160256
SD
15.2151241
SD
13.9731886
Kurtosis
−2.7638374
Kurtosis
−1.2780859
Kurtosis
2.17910606
Skewness
0.27774386
Skewness
−0.095818
Skewness
1.68419433
Count
5
Count
5
Count
9
of technology readiness levels) result and Method 2 (percentage of checklist compliance of the J-TRA parameters) result are similar. However, Method 3 (J-TRA results
in TRL), while the curve looks very different from the previous two methods, it has
positive skewness value, which is similar to Method 1. This imply that given the
simplicity of Method 1, it is actually good enough to inform the overall progress of a
project’s readiness. The weakness of Method 1 is however, that it does not allow one
to identify what aspect of the technology development that is preforming poorly (the
bottleneck) and therefore it is difficult to, for example, determine budget priority in
order to accelerate the project towards a higher readiness level.
36.4.2 The Common Bottleneck and Opportunities Among
the Technology Development Projects
Among the discussed projects in different Southeast Asian countries (Sect. 3.3), the
most prevalent challenges were the “commercialization” and “verification” aspects.
The checklist questions of the commercialization element are around the issues of
business development, mass production, and major issues for horizontal development. Indicating that most of the projects’ bottleneck are not yet commercialized.
Commercialization leads to cost reduction and ease for mass dissemination. On the
other hand, the checklist questions of the verification element are around the issues of
whether CO 2 reduction techniques have been considered and integrated to the developed technology and whether the technology work in the actual target environment.
This indicates that some of the projects have not been measured for its CO 2 reduction
effect and tested for an actual full-scale operation in the targeted environment.
I. Ihara et al.
Table 36.4 Descriptive statistics of each method
Method 1
Method 2
Method 3
Mean
16.8
Mean
20
Mean
9.33333333
Standard Err
4.74763099
Standard Err
6.80441033
Standard Err
4.65772954
Median
13
Median
17
Median
3
SD
10.6160256
SD
15.2151241
SD
13.9731886
Kurtosis
−2.7638374
Kurtosis
−1.2780859
Kurtosis
2.17910606
Skewness
0.27774386
Skewness
−0.095818
Skewness
1.68419433
Count
5
Count
5
Count
9
of technology readiness levels) result and Method 2 (percentage of checklist compliance of the J-TRA parameters) result are similar. However, Method 3 (J-TRA results
in TRL), while the curve looks very different from the previous two methods, it has
positive skewness value, which is similar to Method 1. This imply that given the
simplicity of Method 1, it is actually good enough to inform the overall progress of a
project’s readiness. The weakness of Method 1 is however, that it does not allow one
to identify what aspect of the technology development that is preforming poorly (the
bottleneck) and therefore it is difficult to, for example, determine budget priority in
order to accelerate the project towards a higher readiness level.
36.4.2 The Common Bottleneck and Opportunities Among
the Technology Development Projects
Among the discussed projects in different Southeast Asian countries (Sect. 3.3), the
most prevalent challenges were the “commercialization” and “verification” aspects.
The checklist questions of the commercialization element are around the issues of
business development, mass production, and major issues for horizontal development. Indicating that most of the projects’ bottleneck are not yet commercialized.
Commercialization leads to cost reduction and ease for mass dissemination. On the
other hand, the checklist questions of the verification element are around the issues of
whether CO 2 reduction techniques have been considered and integrated to the developed technology and whether the technology work in the actual target environment.
This indicates that some of the projects have not been measured for its CO 2 reduction
effect and tested for an actual full-scale operation in the targeted environment.