

35 Exergy and Environmental Analysis of a Bio-Hydrogen Supply …
537
35.4.2 Exergy Efficiency
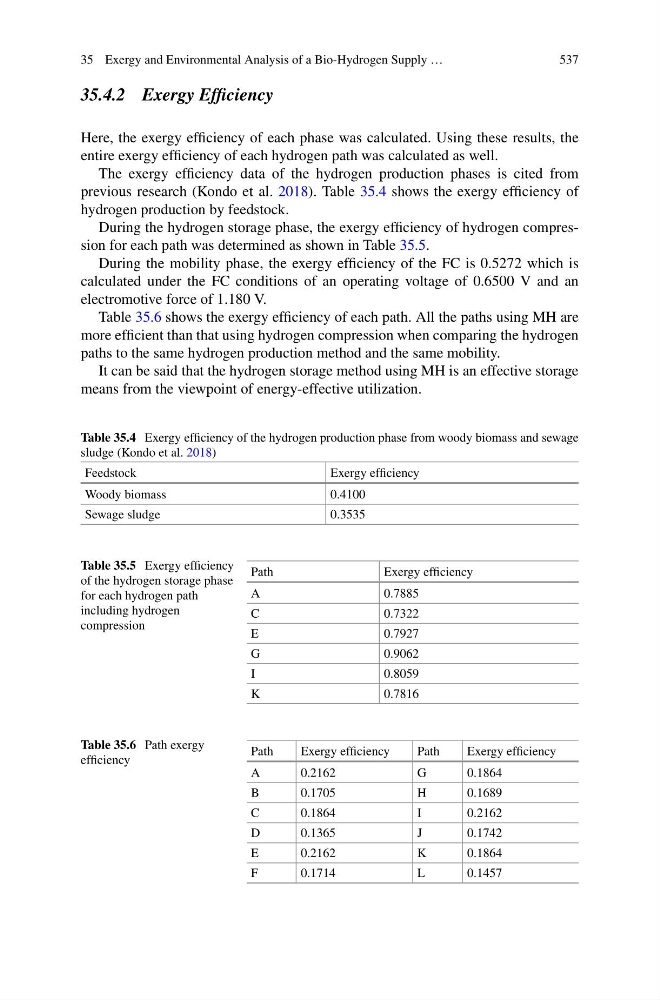
Here, the exergy efficiency of each phase was calculated. Using these results, the
entire exergy efficiency of each hydrogen path was calculated as well.
The exergy efficiency data of the hydrogen production phases is cited from
previous research (Kondo et al. 2018). Table 35.4 shows the exergy efficiency of
hydrogen production by feedstock.
During the hydrogen storage phase, the exergy efficiency of hydrogen compression for each path was determined as shown in Table 35.5.
During the mobility phase, the exergy efficiency of the FC is 0.5272 which is
calculated under the FC conditions of an operating voltage of 0.6500 V and an
electromotive force of 1.180 V.
Table 35.6 shows the exergy efficiency of each path. All the paths using MH are
more efficient than that using hydrogen compression when comparing the hydrogen
paths to the same hydrogen production method and the same mobility.
It can be said that the hydrogen storage method using MH is an effective storage
means from the viewpoint of energy-effective utilization.
Table 35.4 Exergy efficiency of the hydrogen production phase from woody biomass and sewage
sludge (Kondo et al. 2018)
Feedstock
Exergy efficiency
Woody biomass
0.4100
Sewage sludge
0.3535
Table 35.5 Exergy efficiency
of the hydrogen storage phase
for each hydrogen path
including hydrogen
compression
Path
Exergy efficiency
A
0.7885
C
0.7322
E
0.7927
G
0.9062
I
0.8059
K
0.7816
Table 35.6 Path exergy
efficiency
Path
Exergy efficiency
Path
Exergy efficiency
A
0.2162
G
0.1864
B
0.1705
H
0.1689
C
0.1864
I
0.2162
D
0.1365
J
0.1742
E
0.2162
K
0.1864
F
0.1714
L
0.1457
537
35.4.2 Exergy Efficiency
Here, the exergy efficiency of each phase was calculated. Using these results, the
entire exergy efficiency of each hydrogen path was calculated as well.
The exergy efficiency data of the hydrogen production phases is cited from
previous research (Kondo et al. 2018). Table 35.4 shows the exergy efficiency of
hydrogen production by feedstock.
During the hydrogen storage phase, the exergy efficiency of hydrogen compression for each path was determined as shown in Table 35.5.
During the mobility phase, the exergy efficiency of the FC is 0.5272 which is
calculated under the FC conditions of an operating voltage of 0.6500 V and an
electromotive force of 1.180 V.
Table 35.6 shows the exergy efficiency of each path. All the paths using MH are
more efficient than that using hydrogen compression when comparing the hydrogen
paths to the same hydrogen production method and the same mobility.
It can be said that the hydrogen storage method using MH is an effective storage
means from the viewpoint of energy-effective utilization.
Table 35.4 Exergy efficiency of the hydrogen production phase from woody biomass and sewage
sludge (Kondo et al. 2018)
Feedstock
Exergy efficiency
Woody biomass
0.4100
Sewage sludge
0.3535
Table 35.5 Exergy efficiency
of the hydrogen storage phase
for each hydrogen path
including hydrogen
compression
Path
Exergy efficiency
A
0.7885
C
0.7322
E
0.7927
G
0.9062
I
0.8059
K
0.7816
Table 35.6 Path exergy
efficiency
Path
Exergy efficiency
Path
Exergy efficiency
A
0.2162
G
0.1864
B
0.1705
H
0.1689
C
0.1864
I
0.2162
D
0.1365
J
0.1742
E
0.2162
K
0.1864
F
0.1714
L
0.1457