

532
D. Hara et al.
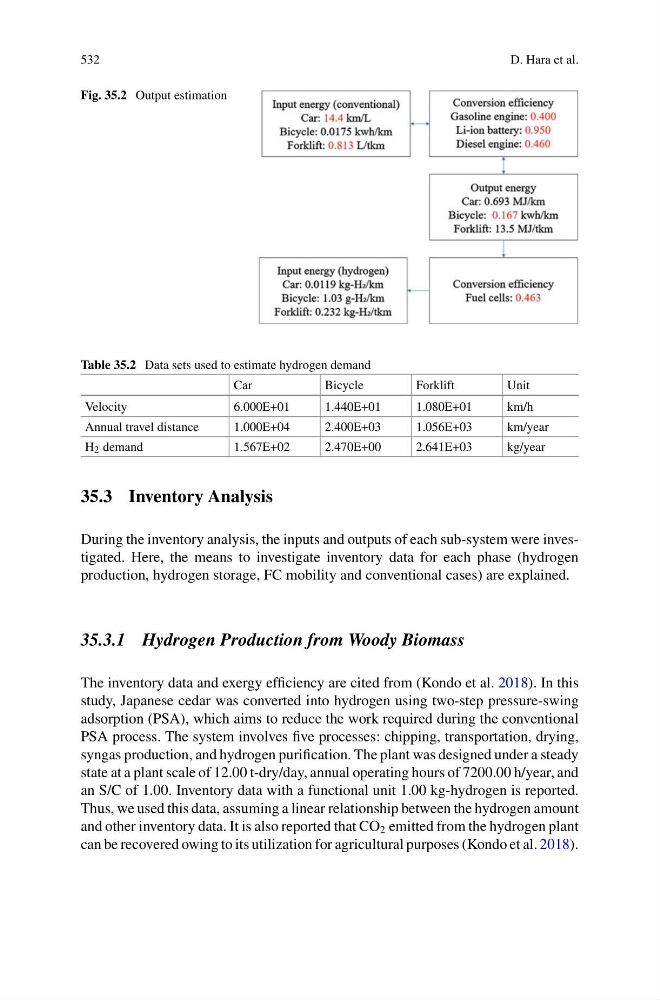
Fig. 35.2 Output estimation
Table 35.2 Data sets used to estimate hydrogen demand
Car
Bicycle
Forklift
Unit
Velocity
6.000E+01
1.440E+01
1.080E+01
km/h
Annual travel distance
1.000E+04
2.400E+03
1.056E+03
km/year
H 2 demand
1.567E+02
2.470E+00
2.641E+03
kg/year
35.3 Inventory Analysis
During the inventory analysis, the inputs and outputs of each sub-system were investigated. Here, the means to investigate inventory data for each phase (hydrogen
production, hydrogen storage, FC mobility and conventional cases) are explained.
35.3.1 Hydrogen Production from Woody Biomass
The inventory data and exergy efficiency are cited from (Kondo et al. 2018). In this
study, Japanese cedar was converted into hydrogen using two-step pressure-swing
adsorption (PSA), which aims to reduce the work required during the conventional
PSA process. The system involves five processes: chipping, transportation, drying,
syngas production, and hydrogen purification. The plant was designed under a steady
state at a plant scale of 12.00 t-dry/day, annual operating hours of 7200.00 h/year, and
an S/C of 1.00. Inventory data with a functional unit 1.00 kg-hydrogen is reported.
Thus, we used this data, assuming a linear relationship between the hydrogen amount
and other inventory data. It is also reported that CO 2 emitted from the hydrogen plant
can be recovered owing to its utilization for agricultural purposes (Kondo et al. 2018).
D. Hara et al.
Fig. 35.2 Output estimation
Table 35.2 Data sets used to estimate hydrogen demand
Car
Bicycle
Forklift
Unit
Velocity
6.000E+01
1.440E+01
1.080E+01
km/h
Annual travel distance
1.000E+04
2.400E+03
1.056E+03
km/year
H 2 demand
1.567E+02
2.470E+00
2.641E+03
kg/year
35.3 Inventory Analysis
During the inventory analysis, the inputs and outputs of each sub-system were investigated. Here, the means to investigate inventory data for each phase (hydrogen
production, hydrogen storage, FC mobility and conventional cases) are explained.
35.3.1 Hydrogen Production from Woody Biomass
The inventory data and exergy efficiency are cited from (Kondo et al. 2018). In this
study, Japanese cedar was converted into hydrogen using two-step pressure-swing
adsorption (PSA), which aims to reduce the work required during the conventional
PSA process. The system involves five processes: chipping, transportation, drying,
syngas production, and hydrogen purification. The plant was designed under a steady
state at a plant scale of 12.00 t-dry/day, annual operating hours of 7200.00 h/year, and
an S/C of 1.00. Inventory data with a functional unit 1.00 kg-hydrogen is reported.
Thus, we used this data, assuming a linear relationship between the hydrogen amount
and other inventory data. It is also reported that CO 2 emitted from the hydrogen plant
can be recovered owing to its utilization for agricultural purposes (Kondo et al. 2018).