

34 Social Equity and Lifestyle Conscious Policy Making …
521
45.71
45.72
45.73
45.74
45.75
45.76
45.77
45.78
1
9
17
25
33
41
49
57
65
73
81
89
97
105
113
121
129
137
145
153
161
169
177
185
193
201
209
217
225
233
241
249
257
265
273
281
289
297
305
313
321
329
337
345
353
361
369
377
385
393
401
Consump on burden score
Commodity number of TJIO
65.41
65.43
65.45
65.47
65.49
65.51
65.53
65.55
65.57
1
9
17
25
33
41
49
57
65
73
81
89
97
105
113
121
129
137
145
153
161
169
177
185
193
201
209
217
225
233
241
249
257
265
273
281
289
297
305
313
321
329
337
345
353
361
369
377
385
393
401
Social inequity score
Commodity number of TJIO
65.491 (BaU)
gasoline
kerosene
restaurant
electricity
hotel
45.742 (BaU)
house rent
kerosene
medicals
LPG
city gas
Lunchbox
When total consump on
increased by 10%
When total consump on
decreased by 10%
When total consump on
decreased by 10%
When total consump on
increased by 10%
(a)
(b)
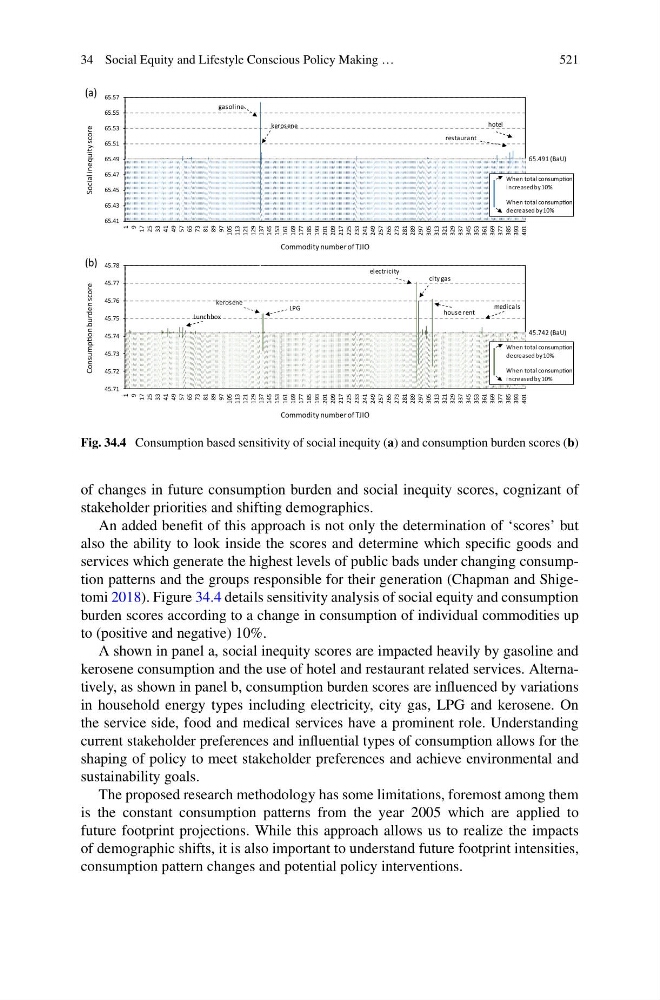
Fig. 34.4 Consumption based sensitivity of social inequity (a) and consumption burden scores (b)
of changes in future consumption burden and social inequity scores, cognizant of
stakeholder priorities and shifting demographics.
An added benefit of this approach is not only the determination of ‘scores’ but
also the ability to look inside the scores and determine which specific goods and
services which generate the highest levels of public bads under changing consumption patterns and the groups responsible for their generation (Chapman and Shigetomi 2018). Figure 34.4 details sensitivity analysis of social equity and consumption
burden scores according to a change in consumption of individual commodities up
to (positive and negative) 10%.
A shown in panel a, social inequity scores are impacted heavily by gasoline and
kerosene consumption and the use of hotel and restaurant related services. Alternatively, as shown in panel b, consumption burden scores are influenced by variations
in household energy types including electricity, city gas, LPG and kerosene. On
the service side, food and medical services have a prominent role. Understanding
current stakeholder preferences and influential types of consumption allows for the
shaping of policy to meet stakeholder preferences and achieve environmental and
sustainability goals.
The proposed research methodology has some limitations, foremost among them
is the constant consumption patterns from the year 2005 which are applied to
future footprint projections. While this approach allows us to realize the impacts
of demographic shifts, it is also important to understand future footprint intensities,
consumption pattern changes and potential policy interventions.
521
45.71
45.72
45.73
45.74
45.75
45.76
45.77
45.78
1
9
17
25
33
41
49
57
65
73
81
89
97
105
113
121
129
137
145
153
161
169
177
185
193
201
209
217
225
233
241
249
257
265
273
281
289
297
305
313
321
329
337
345
353
361
369
377
385
393
401
Consump on burden score
Commodity number of TJIO
65.41
65.43
65.45
65.47
65.49
65.51
65.53
65.55
65.57
1
9
17
25
33
41
49
57
65
73
81
89
97
105
113
121
129
137
145
153
161
169
177
185
193
201
209
217
225
233
241
249
257
265
273
281
289
297
305
313
321
329
337
345
353
361
369
377
385
393
401
Social inequity score
Commodity number of TJIO
65.491 (BaU)
gasoline
kerosene
restaurant
electricity
hotel
45.742 (BaU)
house rent
kerosene
medicals
LPG
city gas
Lunchbox
When total consump on
increased by 10%
When total consump on
decreased by 10%
When total consump on
decreased by 10%
When total consump on
increased by 10%
(a)
(b)
Fig. 34.4 Consumption based sensitivity of social inequity (a) and consumption burden scores (b)
of changes in future consumption burden and social inequity scores, cognizant of
stakeholder priorities and shifting demographics.
An added benefit of this approach is not only the determination of ‘scores’ but
also the ability to look inside the scores and determine which specific goods and
services which generate the highest levels of public bads under changing consumption patterns and the groups responsible for their generation (Chapman and Shigetomi 2018). Figure 34.4 details sensitivity analysis of social equity and consumption
burden scores according to a change in consumption of individual commodities up
to (positive and negative) 10%.
A shown in panel a, social inequity scores are impacted heavily by gasoline and
kerosene consumption and the use of hotel and restaurant related services. Alternatively, as shown in panel b, consumption burden scores are influenced by variations
in household energy types including electricity, city gas, LPG and kerosene. On
the service side, food and medical services have a prominent role. Understanding
current stakeholder preferences and influential types of consumption allows for the
shaping of policy to meet stakeholder preferences and achieve environmental and
sustainability goals.
The proposed research methodology has some limitations, foremost among them
is the constant consumption patterns from the year 2005 which are applied to
future footprint projections. While this approach allows us to realize the impacts
of demographic shifts, it is also important to understand future footprint intensities,
consumption pattern changes and potential policy interventions.