

518
A. J. Chapman and Y. Shigetomi
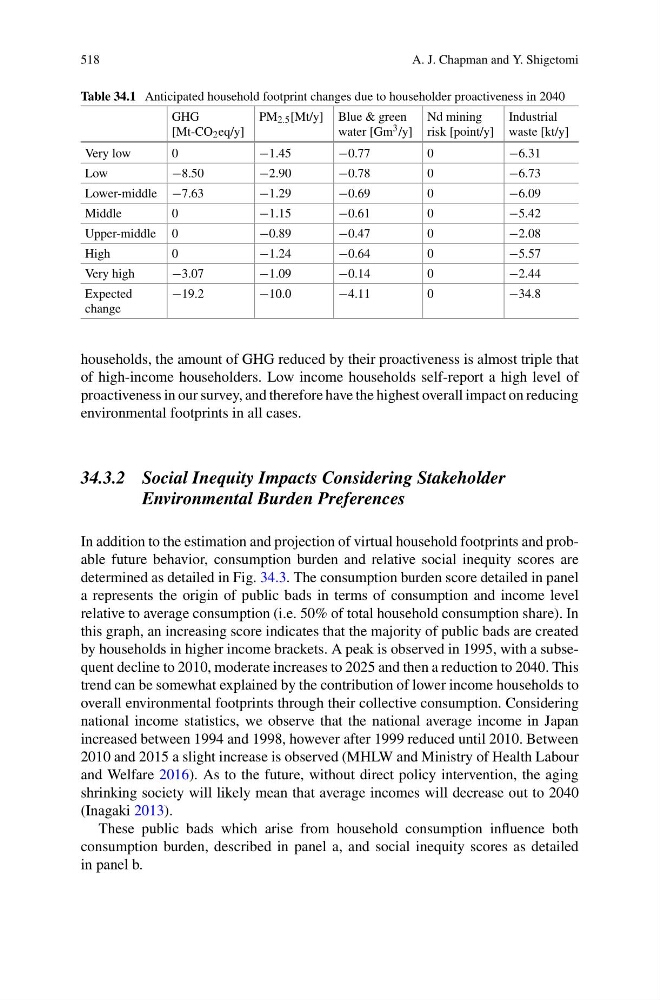
Table 34.1 Anticipated household footprint changes due to householder proactiveness in 2040
GHG
[Mt-CO 2 eq/y]
PM 2.5 [Mt/y] Blue & green
water [Gm 3 /y]
Nd mining
risk [point/y]
Industrial
waste [kt/y]
Very low
0
−1.45
−0.77
0
−6.31
Low
−8.50
−2.90
−0.78
0
−6.73
Lower-middle −7.63
−1.29
−0.69
0
−6.09
Middle
0
−1.15
−0.61
0
−5.42
Upper-middle 0
−0.89
−0.47
0
−2.08
High
0
−1.24
−0.64
0
−5.57
Very high
−3.07
−1.09
−0.14
0
−2.44
Expected
change
−19.2
−10.0
−4.11
0
−34.8
households, the amount of GHG reduced by their proactiveness is almost triple that
of high-income householders. Low income households self-report a high level of
proactiveness in our survey, and therefore have the highest overall impact on reducing
environmental footprints in all cases.
34.3.2 Social Inequity Impacts Considering Stakeholder
Environmental Burden Preferences
In addition to the estimation and projection of virtual household footprints and probable future behavior, consumption burden and relative social inequity scores are
determined as detailed in Fig. 34.3. The consumption burden score detailed in panel
a represents the origin of public bads in terms of consumption and income level
relative to average consumption (i.e. 50% of total household consumption share). In
this graph, an increasing score indicates that the majority of public bads are created
by households in higher income brackets. A peak is observed in 1995, with a subsequent decline to 2010, moderate increases to 2025 and then a reduction to 2040. This
trend can be somewhat explained by the contribution of lower income households to
overall environmental footprints through their collective consumption. Considering
national income statistics, we observe that the national average income in Japan
increased between 1994 and 1998, however after 1999 reduced until 2010. Between
2010 and 2015 a slight increase is observed (MHLW and Ministry of Health Labour
and Welfare 2016). As to the future, without direct policy intervention, the aging
shrinking society will likely mean that average incomes will decrease out to 2040
(Inagaki 2013).
These public bads which arise from household consumption influence both
consumption burden, described in panel a, and social inequity scores as detailed
in panel b.
A. J. Chapman and Y. Shigetomi
Table 34.1 Anticipated household footprint changes due to householder proactiveness in 2040
GHG
[Mt-CO 2 eq/y]
PM 2.5 [Mt/y] Blue & green
water [Gm 3 /y]
Nd mining
risk [point/y]
Industrial
waste [kt/y]
Very low
0
−1.45
−0.77
0
−6.31
Low
−8.50
−2.90
−0.78
0
−6.73
Lower-middle −7.63
−1.29
−0.69
0
−6.09
Middle
0
−1.15
−0.61
0
−5.42
Upper-middle 0
−0.89
−0.47
0
−2.08
High
0
−1.24
−0.64
0
−5.57
Very high
−3.07
−1.09
−0.14
0
−2.44
Expected
change
−19.2
−10.0
−4.11
0
−34.8
households, the amount of GHG reduced by their proactiveness is almost triple that
of high-income householders. Low income households self-report a high level of
proactiveness in our survey, and therefore have the highest overall impact on reducing
environmental footprints in all cases.
34.3.2 Social Inequity Impacts Considering Stakeholder
Environmental Burden Preferences
In addition to the estimation and projection of virtual household footprints and probable future behavior, consumption burden and relative social inequity scores are
determined as detailed in Fig. 34.3. The consumption burden score detailed in panel
a represents the origin of public bads in terms of consumption and income level
relative to average consumption (i.e. 50% of total household consumption share). In
this graph, an increasing score indicates that the majority of public bads are created
by households in higher income brackets. A peak is observed in 1995, with a subsequent decline to 2010, moderate increases to 2025 and then a reduction to 2040. This
trend can be somewhat explained by the contribution of lower income households to
overall environmental footprints through their collective consumption. Considering
national income statistics, we observe that the national average income in Japan
increased between 1994 and 1998, however after 1999 reduced until 2010. Between
2010 and 2015 a slight increase is observed (MHLW and Ministry of Health Labour
and Welfare 2016). As to the future, without direct policy intervention, the aging
shrinking society will likely mean that average incomes will decrease out to 2040
(Inagaki 2013).
These public bads which arise from household consumption influence both
consumption burden, described in panel a, and social inequity scores as detailed
in panel b.