

516
A. J. Chapman and Y. Shigetomi
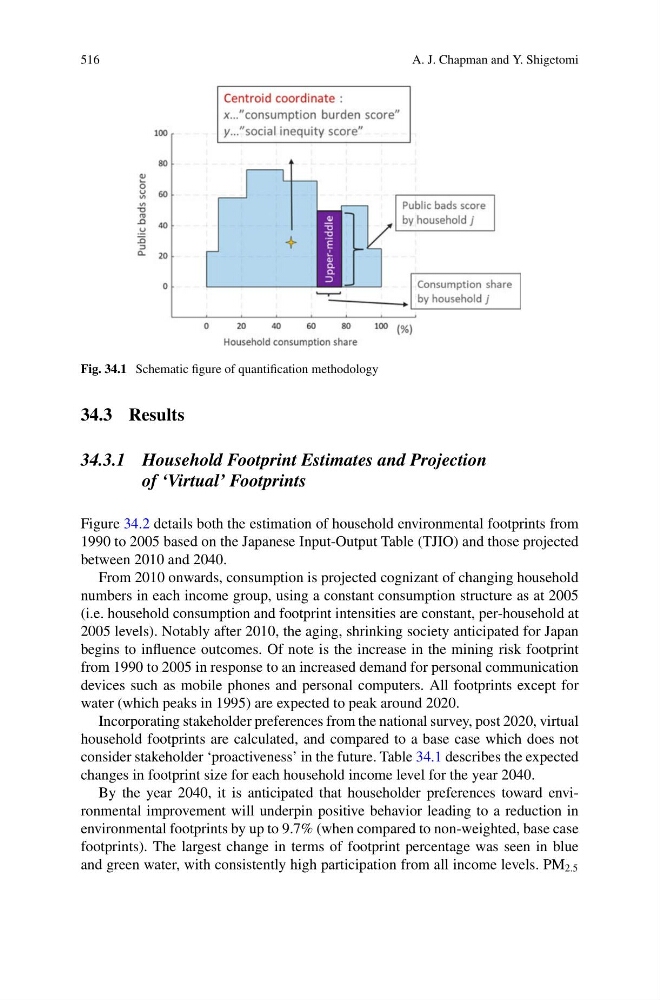
Fig. 34.1 Schematic figure of quantification methodology
34.3 Results
34.3.1 Household Footprint Estimates and Projection
of ‘Virtual’ Footprints
Figure 34.2 details both the estimation of household environmental footprints from
1990 to 2005 based on the Japanese Input-Output Table (TJIO) and those projected
between 2010 and 2040.
From 2010 onwards, consumption is projected cognizant of changing household
numbers in each income group, using a constant consumption structure as at 2005
(i.e. household consumption and footprint intensities are constant, per-household at
2005 levels). Notably after 2010, the aging, shrinking society anticipated for Japan
begins to influence outcomes. Of note is the increase in the mining risk footprint
from 1990 to 2005 in response to an increased demand for personal communication
devices such as mobile phones and personal computers. All footprints except for
water (which peaks in 1995) are expected to peak around 2020.
Incorporating stakeholder preferences from the national survey, post 2020, virtual
household footprints are calculated, and compared to a base case which does not
consider stakeholder ‘proactiveness’ in the future. Table 34.1 describes the expected
changes in footprint size for each household income level for the year 2040.
By the year 2040, it is anticipated that householder preferences toward environmental improvement will underpin positive behavior leading to a reduction in
environmental footprints by up to 9.7% (when compared to non-weighted, base case
footprints). The largest change in terms of footprint percentage was seen in blue
and green water, with consistently high participation from all income levels. PM 2.5
A. J. Chapman and Y. Shigetomi
Fig. 34.1 Schematic figure of quantification methodology
34.3 Results
34.3.1 Household Footprint Estimates and Projection
of ‘Virtual’ Footprints
Figure 34.2 details both the estimation of household environmental footprints from
1990 to 2005 based on the Japanese Input-Output Table (TJIO) and those projected
between 2010 and 2040.
From 2010 onwards, consumption is projected cognizant of changing household
numbers in each income group, using a constant consumption structure as at 2005
(i.e. household consumption and footprint intensities are constant, per-household at
2005 levels). Notably after 2010, the aging, shrinking society anticipated for Japan
begins to influence outcomes. Of note is the increase in the mining risk footprint
from 1990 to 2005 in response to an increased demand for personal communication
devices such as mobile phones and personal computers. All footprints except for
water (which peaks in 1995) are expected to peak around 2020.
Incorporating stakeholder preferences from the national survey, post 2020, virtual
household footprints are calculated, and compared to a base case which does not
consider stakeholder ‘proactiveness’ in the future. Table 34.1 describes the expected
changes in footprint size for each household income level for the year 2040.
By the year 2040, it is anticipated that householder preferences toward environmental improvement will underpin positive behavior leading to a reduction in
environmental footprints by up to 9.7% (when compared to non-weighted, base case
footprints). The largest change in terms of footprint percentage was seen in blue
and green water, with consistently high participation from all income levels. PM 2.5