

284
Z. Liang et al.
1.64%
1.62%
1.69%
10.31%
10.09%
11.16%
15.88%
15.77%
16.26%
80.79%
80.12%
83.12%
49.62%
48.52%
53.70%
37.21%
36.95%
38.11%
0.005%
0.005%
0.005%
0.12%
0.12%
0.13%
0.02%
0.02%
0.02%
11.71%
11.62%
12.05%
24.07%
23.54%
26.05%
41.92%
41.62%
42.94%
5.77%
6.63%
2.66%
15.66%
17.72%
7.58%
4.91%
5.64%
2.25%
0.08%
0.004%
0.49%
0.22%
0.01%
1.39%
0.07%
0.004%
0.41%
0%
10%
20%
30%
40%
50%
60%
70%
80%
90%
100%
S1
S2
S3
S4
S5
S6
S7
S8
S9
SCENARIO
CO2 emissions from sewage treat.
N2O emissions from sewage treat.
GHG emissions from chemicals
GHG emissions from electricity
direct GHG emissions from sludge treat.
indirect GHG emissions from sludge treat.
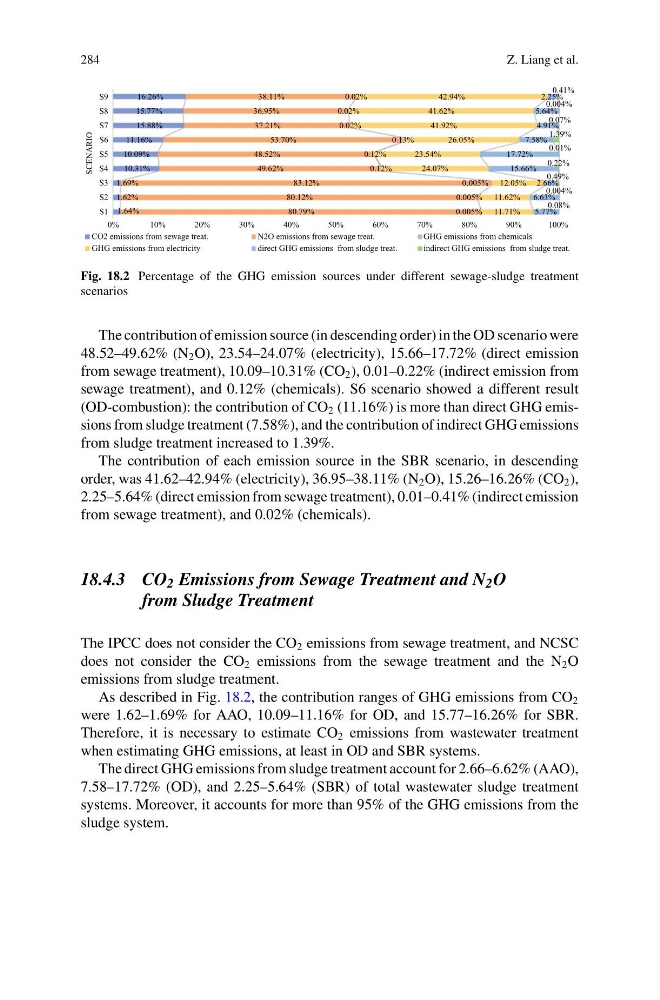
Fig. 18.2 Percentage of the GHG emission sources under different sewage-sludge treatment
scenarios
The contribution of emission source (in descending order) in the OD scenario were
48.52–49.62% (N 2 O), 23.54–24.07% (electricity), 15.66–17.72% (direct emission
from sewage treatment), 10.09–10.31% (CO 2 ), 0.01–0.22% (indirect emission from
sewage treatment), and 0.12% (chemicals). S6 scenario showed a different result
(OD-combustion): the contribution of CO 2 (11.16%) is more than direct GHG emissions from sludge treatment (7.58%), and the contribution of indirect GHG emissions
from sludge treatment increased to 1.39%.
The contribution of each emission source in the SBR scenario, in descending
order, was 41.62–42.94% (electricity), 36.95–38.11% (N 2 O), 15.26–16.26% (CO 2 ),
2.25–5.64% (direct emission from sewage treatment), 0.01–0.41% (indirect emission
from sewage treatment), and 0.02% (chemicals).
18.4.3 CO 2 Emissions from Sewage Treatment and N 2 O
from Sludge Treatment
The IPCC does not consider the CO 2 emissions from sewage treatment, and NCSC
does not consider the CO 2 emissions from the sewage treatment and the N 2 O
emissions from sludge treatment.
As described in Fig. 18.2, the contribution ranges of GHG emissions from CO 2
were 1.62–1.69% for AAO, 10.09–11.16% for OD, and 15.77–16.26% for SBR.
Therefore, it is necessary to estimate CO 2 emissions from wastewater treatment
when estimating GHG emissions, at least in OD and SBR systems.
The direct GHG emissions from sludge treatment account for 2.66–6.62% (AAO),
7.58–17.72% (OD), and 2.25–5.64% (SBR) of total wastewater sludge treatment
systems. Moreover, it accounts for more than 95% of the GHG emissions from the
sludge system.
Z. Liang et al.
1.64%
1.62%
1.69%
10.31%
10.09%
11.16%
15.88%
15.77%
16.26%
80.79%
80.12%
83.12%
49.62%
48.52%
53.70%
37.21%
36.95%
38.11%
0.005%
0.005%
0.005%
0.12%
0.12%
0.13%
0.02%
0.02%
0.02%
11.71%
11.62%
12.05%
24.07%
23.54%
26.05%
41.92%
41.62%
42.94%
5.77%
6.63%
2.66%
15.66%
17.72%
7.58%
4.91%
5.64%
2.25%
0.08%
0.004%
0.49%
0.22%
0.01%
1.39%
0.07%
0.004%
0.41%
0%
10%
20%
30%
40%
50%
60%
70%
80%
90%
100%
S1
S2
S3
S4
S5
S6
S7
S8
S9
SCENARIO
CO2 emissions from sewage treat.
N2O emissions from sewage treat.
GHG emissions from chemicals
GHG emissions from electricity
direct GHG emissions from sludge treat.
indirect GHG emissions from sludge treat.
Fig. 18.2 Percentage of the GHG emission sources under different sewage-sludge treatment
scenarios
The contribution of emission source (in descending order) in the OD scenario were
48.52–49.62% (N 2 O), 23.54–24.07% (electricity), 15.66–17.72% (direct emission
from sewage treatment), 10.09–10.31% (CO 2 ), 0.01–0.22% (indirect emission from
sewage treatment), and 0.12% (chemicals). S6 scenario showed a different result
(OD-combustion): the contribution of CO 2 (11.16%) is more than direct GHG emissions from sludge treatment (7.58%), and the contribution of indirect GHG emissions
from sludge treatment increased to 1.39%.
The contribution of each emission source in the SBR scenario, in descending
order, was 41.62–42.94% (electricity), 36.95–38.11% (N 2 O), 15.26–16.26% (CO 2 ),
2.25–5.64% (direct emission from sewage treatment), 0.01–0.41% (indirect emission
from sewage treatment), and 0.02% (chemicals).
18.4.3 CO 2 Emissions from Sewage Treatment and N 2 O
from Sludge Treatment
The IPCC does not consider the CO 2 emissions from sewage treatment, and NCSC
does not consider the CO 2 emissions from the sewage treatment and the N 2 O
emissions from sludge treatment.
As described in Fig. 18.2, the contribution ranges of GHG emissions from CO 2
were 1.62–1.69% for AAO, 10.09–11.16% for OD, and 15.77–16.26% for SBR.
Therefore, it is necessary to estimate CO 2 emissions from wastewater treatment
when estimating GHG emissions, at least in OD and SBR systems.
The direct GHG emissions from sludge treatment account for 2.66–6.62% (AAO),
7.58–17.72% (OD), and 2.25–5.64% (SBR) of total wastewater sludge treatment
systems. Moreover, it accounts for more than 95% of the GHG emissions from the
sludge system.