

274
Z. Liang et al.
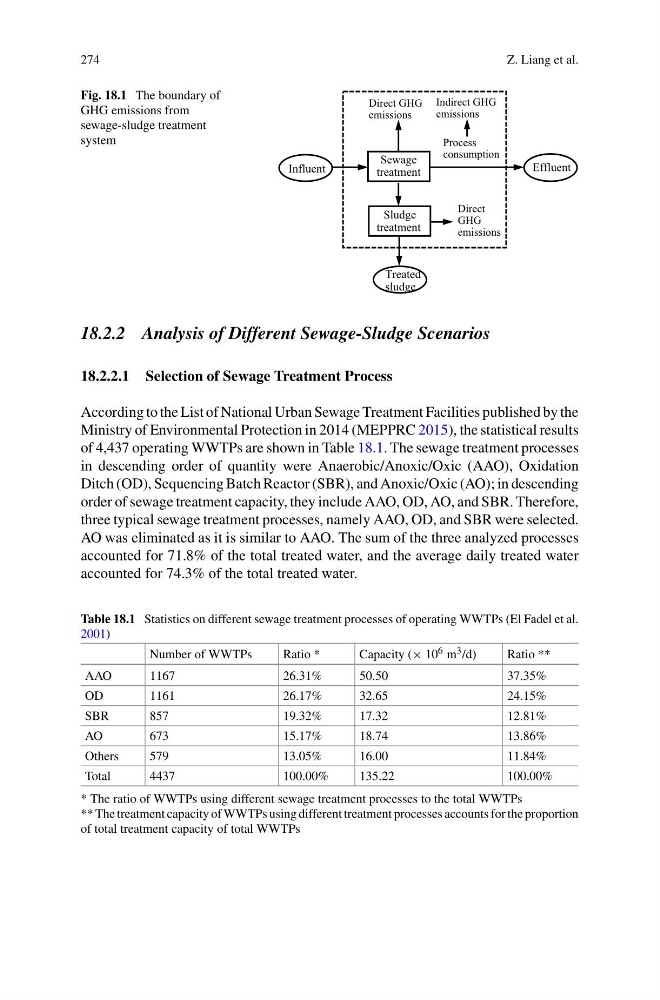
Fig. 18.1 The boundary of
GHG emissions from
sewage-sludge treatment
system
Sludge
treatment
Influent
Effluent
Sewage
treatment
Direct GHG
emissions
Direct
GHG
emissions
Treated
sludge
Indirect GHG
emissions
Process
consumption
18.2.2 Analysis of Different Sewage-Sludge Scenarios
18.2.2.1 Selection of Sewage Treatment Process
According to the List of National Urban Sewage Treatment Facilities published by the
Ministry of Environmental Protection in 2014 (MEPPRC 2015), the statistical results
of 4,437 operating WWTPs are shown in Table 18.1. The sewage treatment processes
in descending order of quantity were Anaerobic/Anoxic/Oxic (AAO), Oxidation
Ditch (OD), Sequencing Batch Reactor (SBR), and Anoxic/Oxic (AO); in descending
order of sewage treatment capacity, they include AAO, OD, AO, and SBR. Therefore,
three typical sewage treatment processes, namely AAO, OD, and SBR were selected.
AO was eliminated as it is similar to AAO. The sum of the three analyzed processes
accounted for 71.8% of the total treated water, and the average daily treated water
accounted for 74.3% of the total treated water.
Table 18.1 Statistics on different sewage treatment processes of operating WWTPs (El Fadel et al.
2001)
Number of WWTPs
Ratio *
Capacity (× 10 6 m 3 /d)
Ratio **
AAO
1167
26.31%
50.50
37.35%
OD
1161
26.17%
32.65
24.15%
SBR
857
19.32%
17.32
12.81%
AO
673
15.17%
18.74
13.86%
Others
579
13.05%
16.00
11.84%
Total
4437
100.00%
135.22
100.00%
* The ratio of WWTPs using different sewage treatment processes to the total WWTPs
** The treatment capacity of WWTPs using different treatment processes accounts for the proportion
of total treatment capacity of total WWTPs
Z. Liang et al.
Fig. 18.1 The boundary of
GHG emissions from
sewage-sludge treatment
system
Sludge
treatment
Influent
Effluent
Sewage
treatment
Direct GHG
emissions
Direct
GHG
emissions
Treated
sludge
Indirect GHG
emissions
Process
consumption
18.2.2 Analysis of Different Sewage-Sludge Scenarios
18.2.2.1 Selection of Sewage Treatment Process
According to the List of National Urban Sewage Treatment Facilities published by the
Ministry of Environmental Protection in 2014 (MEPPRC 2015), the statistical results
of 4,437 operating WWTPs are shown in Table 18.1. The sewage treatment processes
in descending order of quantity were Anaerobic/Anoxic/Oxic (AAO), Oxidation
Ditch (OD), Sequencing Batch Reactor (SBR), and Anoxic/Oxic (AO); in descending
order of sewage treatment capacity, they include AAO, OD, AO, and SBR. Therefore,
three typical sewage treatment processes, namely AAO, OD, and SBR were selected.
AO was eliminated as it is similar to AAO. The sum of the three analyzed processes
accounted for 71.8% of the total treated water, and the average daily treated water
accounted for 74.3% of the total treated water.
Table 18.1 Statistics on different sewage treatment processes of operating WWTPs (El Fadel et al.
2001)
Number of WWTPs
Ratio *
Capacity (× 10 6 m 3 /d)
Ratio **
AAO
1167
26.31%
50.50
37.35%
OD
1161
26.17%
32.65
24.15%
SBR
857
19.32%
17.32
12.81%
AO
673
15.17%
18.74
13.86%
Others
579
13.05%
16.00
11.84%
Total
4437
100.00%
135.22
100.00%
* The ratio of WWTPs using different sewage treatment processes to the total WWTPs
** The treatment capacity of WWTPs using different treatment processes accounts for the proportion
of total treatment capacity of total WWTPs