

8 Analysis of the Personal Cars Sustainability in Relation …
117
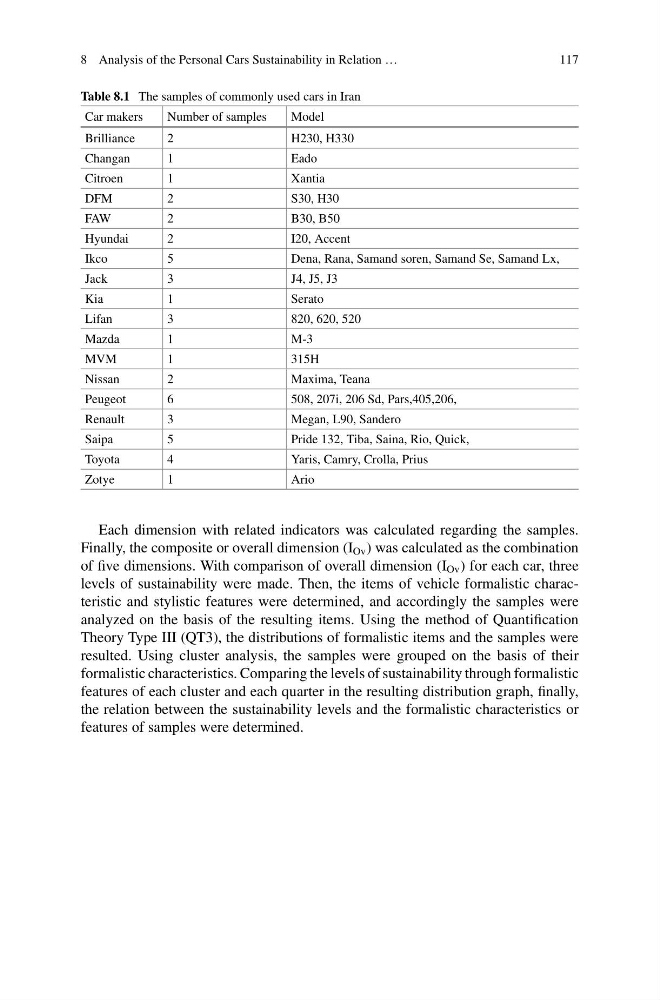
Table 8.1 The samples of commonly used cars in Iran
Car makers
Number of samples
Model
Brilliance
2
H230, H330
Changan
1
Eado
Citroen
1
Xantia
DFM
2
S30, H30
FAW
2
B30, B50
Hyundai
2
I20, Accent
Ikco
5
Dena, Rana, Samand soren, Samand Se, Samand Lx,
Jack
3
J4, J5, J3
Kia
1
Serato
Lifan
3
820, 620, 520
Mazda
1
M-3
MVM
1
315H
Nissan
2
Maxima, Teana
Peugeot
6
508, 207i, 206 Sd, Pars,405,206,
Renault
3
Megan, L90, Sandero
Saipa
5
Pride 132, Tiba, Saina, Rio, Quick,
Toyota
4
Yaris, Camry, Crolla, Prius
Zotye
1
Ario
Each dimension with related indicators was calculated regarding the samples.
Finally, the composite or overall dimension (I Ov ) was calculated as the combination
of five dimensions. With comparison of overall dimension (I Ov ) for each car, three
levels of sustainability were made. Then, the items of vehicle formalistic characteristic and stylistic features were determined, and accordingly the samples were
analyzed on the basis of the resulting items. Using the method of Quantification
Theory Type III (QT3), the distributions of formalistic items and the samples were
resulted. Using cluster analysis, the samples were grouped on the basis of their
formalistic characteristics. Comparing the levels of sustainability through formalistic
features of each cluster and each quarter in the resulting distribution graph, finally,
the relation between the sustainability levels and the formalistic characteristics or
features of samples were determined.
117
Table 8.1 The samples of commonly used cars in Iran
Car makers
Number of samples
Model
Brilliance
2
H230, H330
Changan
1
Eado
Citroen
1
Xantia
DFM
2
S30, H30
FAW
2
B30, B50
Hyundai
2
I20, Accent
Ikco
5
Dena, Rana, Samand soren, Samand Se, Samand Lx,
Jack
3
J4, J5, J3
Kia
1
Serato
Lifan
3
820, 620, 520
Mazda
1
M-3
MVM
1
315H
Nissan
2
Maxima, Teana
Peugeot
6
508, 207i, 206 Sd, Pars,405,206,
Renault
3
Megan, L90, Sandero
Saipa
5
Pride 132, Tiba, Saina, Rio, Quick,
Toyota
4
Yaris, Camry, Crolla, Prius
Zotye
1
Ario
Each dimension with related indicators was calculated regarding the samples.
Finally, the composite or overall dimension (I Ov ) was calculated as the combination
of five dimensions. With comparison of overall dimension (I Ov ) for each car, three
levels of sustainability were made. Then, the items of vehicle formalistic characteristic and stylistic features were determined, and accordingly the samples were
analyzed on the basis of the resulting items. Using the method of Quantification
Theory Type III (QT3), the distributions of formalistic items and the samples were
resulted. Using cluster analysis, the samples were grouped on the basis of their
formalistic characteristics. Comparing the levels of sustainability through formalistic
features of each cluster and each quarter in the resulting distribution graph, finally,
the relation between the sustainability levels and the formalistic characteristics or
features of samples were determined.