

3.4 Examples of Attribution of the Absorption Bands
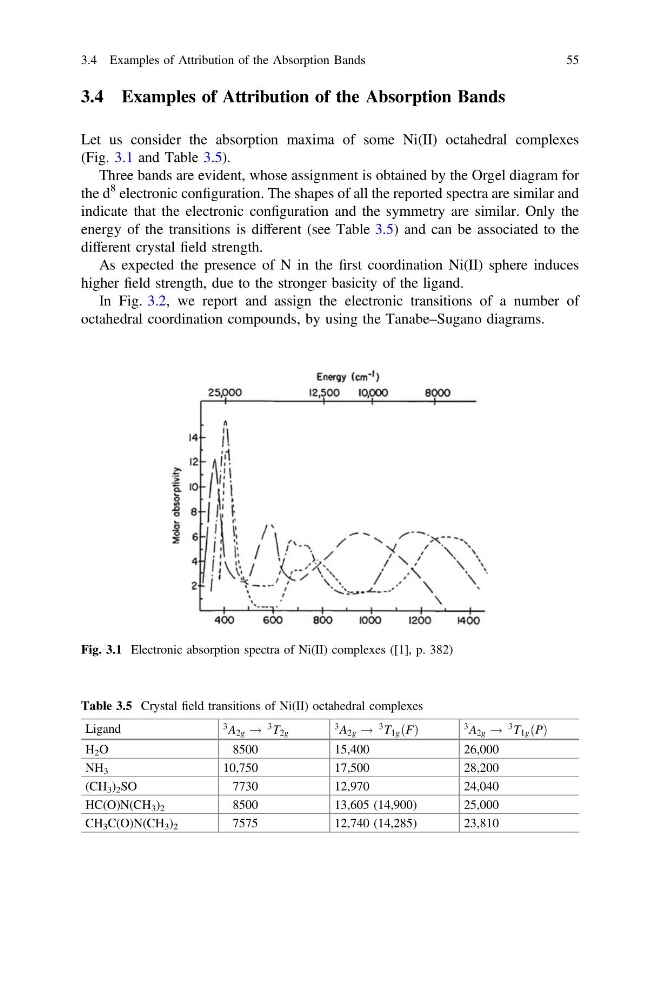
Let us consider the absorption maxima of some Ni(II) octahedral complexes
(Fig. 3.1 and Table 3.5).
Three bands are evident, whose assignment is obtained by the Orgel diagram for
the d
8 electronic configuration. The shapes of all the reported spectra are similar and
indicate that the electronic configuration and the symmetry are similar. Only the
energy of the transitions is different (see Table 3.5) and can be associated to the
different crystal field strength.
As expected the presence of N in the first coordination Ni(II) sphere induces
higher field strength, due to the stronger basicity of the ligand.
In Fig. 3.2, we report and assign the electronic transitions of a number of
octahedral coordination compounds, by using the Tanabe–Sugano diagrams.
Table 3.5 Crystal field transitions of Ni(II) octahedral complexes
Ligand
3 A 2g !
3 T 2g
3 A 2g !
3 T 1g ðFÞ
3 A 2g !
3 T 1g ðPÞ
H 2 O
8500
15,400
26,000
NH 3
10,750
17,500
28,200
(CH 3 ) 2 SO
7730
12,970
24,040
HC(O)N(CH 3 ) 2
8500
13,605 (14,900)
25,000
CH 3 C(O)N(CH 3 ) 2
7575
12,740 (14,285)
23,810
Fig. 3.1 Electronic absorption spectra of Ni(II) complexes ([1], p. 382)
3.4 Examples of Attribution of the Absorption Bands
55
Let us consider the absorption maxima of some Ni(II) octahedral complexes
(Fig. 3.1 and Table 3.5).
Three bands are evident, whose assignment is obtained by the Orgel diagram for
the d
8 electronic configuration. The shapes of all the reported spectra are similar and
indicate that the electronic configuration and the symmetry are similar. Only the
energy of the transitions is different (see Table 3.5) and can be associated to the
different crystal field strength.
As expected the presence of N in the first coordination Ni(II) sphere induces
higher field strength, due to the stronger basicity of the ligand.
In Fig. 3.2, we report and assign the electronic transitions of a number of
octahedral coordination compounds, by using the Tanabe–Sugano diagrams.
Table 3.5 Crystal field transitions of Ni(II) octahedral complexes
Ligand
3 A 2g !
3 T 2g
3 A 2g !
3 T 1g ðFÞ
3 A 2g !
3 T 1g ðPÞ
H 2 O
8500
15,400
26,000
NH 3
10,750
17,500
28,200
(CH 3 ) 2 SO
7730
12,970
24,040
HC(O)N(CH 3 ) 2
8500
13,605 (14,900)
25,000
CH 3 C(O)N(CH 3 ) 2
7575
12,740 (14,285)
23,810
Fig. 3.1 Electronic absorption spectra of Ni(II) complexes ([1], p. 382)
3.4 Examples of Attribution of the Absorption Bands
55