

68
METHODS OF MEASURING PROPERTIES
-1oL
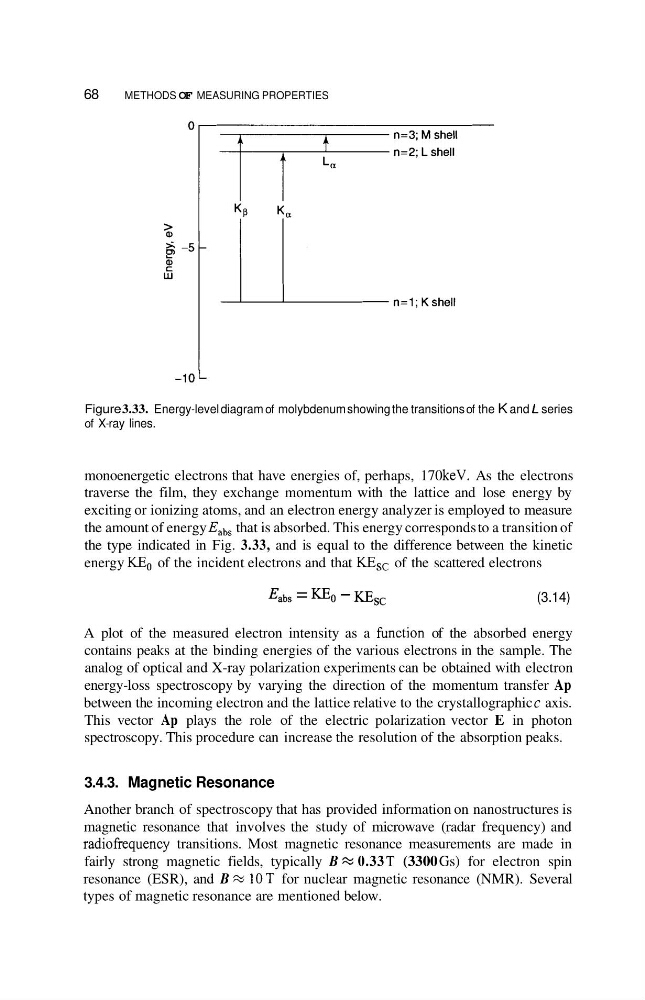
Figure 3.33. Energy-level diagram of molybdenum showing the transitions of the K and L series
of X-ray lines.
monoenergetic electrons that have energies of, perhaps, 170 keV. As the electrons
traverse the film, they exchange momentum with the lattice and lose energy by
exciting or ionizing atoms, and an electron energy analyzer is employed to measure
the amount of energy Eabs that is absorbed. This energy corresponds to a transition of
the type indicated in Fig. 3.33, and is equal to the difference between the kinetic
energy KEo of the incident electrons and that KEsc of the scattered electrons
&bs = KEO -
(3.14)
A plot of the measured electron intensity as a function of the absorbed energy
contains peaks at the binding energies of the various electrons in the sample. The
analog of optical and X-ray polarization experiments can be obtained with electron
energy-loss spectroscopy by varying the direction of the momentum transfer Ap
between the incoming electron and the lattice relative to the crystallographic c axis.
This vector Ap plays the role of the electric polarization vector E in photon
spectroscopy. This procedure can increase the resolution of the absorption peaks.
3.4.3. Magnetic Resonance
Another branch of spectroscopy that has provided information on nanostructures is
magnetic resonance that involves the study of microwave (radar frequency) and
radiofrequency transitions. Most magnetic resonance measurements are made in
fairly strong magnetic fields, typically B x 0.33 T (3300 Gs) for electron spin
resonance (ESR), and B x 10T for nuclear magnetic resonance (NMR). Several
types of magnetic resonance are mentioned below.
METHODS OF MEASURING PROPERTIES
-1oL
Figure 3.33. Energy-level diagram of molybdenum showing the transitions of the K and L series
of X-ray lines.
monoenergetic electrons that have energies of, perhaps, 170 keV. As the electrons
traverse the film, they exchange momentum with the lattice and lose energy by
exciting or ionizing atoms, and an electron energy analyzer is employed to measure
the amount of energy Eabs that is absorbed. This energy corresponds to a transition of
the type indicated in Fig. 3.33, and is equal to the difference between the kinetic
energy KEo of the incident electrons and that KEsc of the scattered electrons
&bs = KEO -
(3.14)
A plot of the measured electron intensity as a function of the absorbed energy
contains peaks at the binding energies of the various electrons in the sample. The
analog of optical and X-ray polarization experiments can be obtained with electron
energy-loss spectroscopy by varying the direction of the momentum transfer Ap
between the incoming electron and the lattice relative to the crystallographic c axis.
This vector Ap plays the role of the electric polarization vector E in photon
spectroscopy. This procedure can increase the resolution of the absorption peaks.
3.4.3. Magnetic Resonance
Another branch of spectroscopy that has provided information on nanostructures is
magnetic resonance that involves the study of microwave (radar frequency) and
radiofrequency transitions. Most magnetic resonance measurements are made in
fairly strong magnetic fields, typically B x 0.33 T (3300 Gs) for electron spin
resonance (ESR), and B x 10T for nuclear magnetic resonance (NMR). Several
types of magnetic resonance are mentioned below.