

224
OPTICAL AND VIBRATIONAL SPECTROSCOPY
40
10
Y - L - 4
Photoluminescence
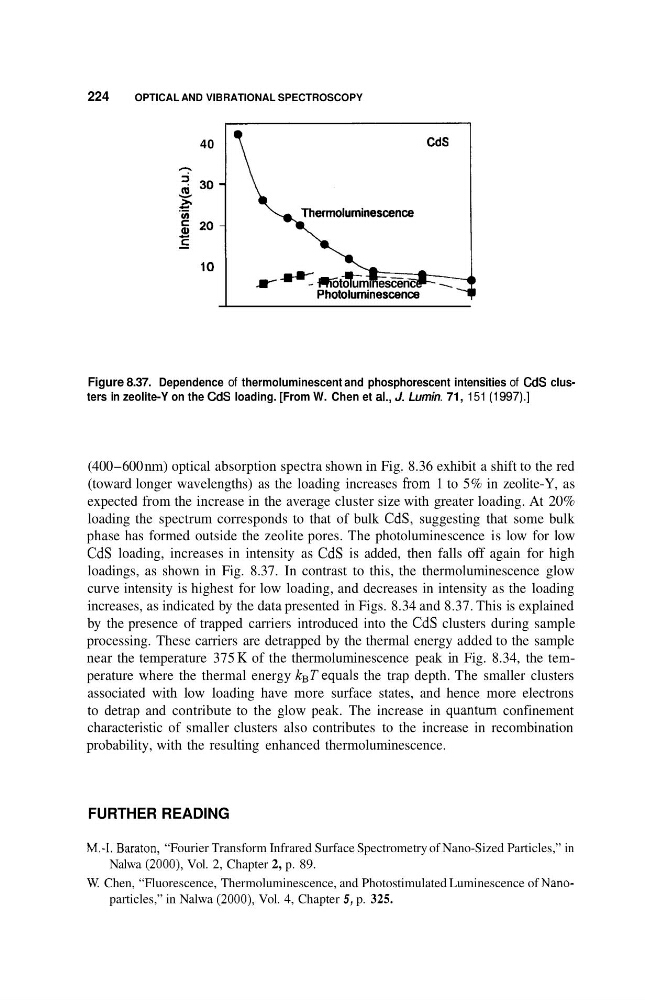
Figure 8.37. Dependence of thermoluminescent and phosphorescent intensities of CdS clusters in zeolite-Y on the CdS loading. [From W. Chen et al., J. Lumin. 71, 151 (1997).]
(400-600 nm) optical absorption spectra shown in Fig. 8.36 exhibit a shift to the red
(toward longer wavelengths) as the loading increases from 1 to 5% in zeolite-Y, as
expected from the increase in the average cluster size with greater loading. At 20%
loading the spectrum corresponds to that of bulk CdS, suggesting that some bulk
phase has formed outside the zeolite pores. The photoluminescence is low for low
CdS loading, increases in intensity as CdS is added, then falls off again for high
loadings, as shown in Fig. 8.37. In contrast to this, the thermoluminescence glow
curve intensity is highest for low loading, and decreases in intensity as the loading
increases, as indicated by the data presented in Figs. 8.34 and 8.37. This is explained
by the presence of trapped carriers introduced into the CdS clusters during sample
processing. These carriers are detrapped by the thermal energy added to the sample
near the temperature 375 K of the thermoluminescence peak in Fig. 8.34, the temperature where the thermal energy kBTequals the trap depth. The smaller clusters
associated with low loading have more surface states, and hence more electrons
to detrap and contribute to the glow peak. The increase in quantum confinement
characteristic of smaller clusters also contributes to the increase in recombination
probability, with the resulting enhanced thermoluminescence.
FURTHER READING
M.4. Baraton, “Fourier Transform Infrared Surface Spectrometry of Nano-Sized Particles,” in
W. Chen, “Fluorescence, Thermoluminescence, and Photostimulated Luminescence of NanoNalwa (ZOOO), Vol. 2, Chapter 2, p. 89.
particles,” in Nalwa (2000), Vol. 4, Chapter 5 , p. 325.
OPTICAL AND VIBRATIONAL SPECTROSCOPY
40
10
Y - L - 4
Photoluminescence
Figure 8.37. Dependence of thermoluminescent and phosphorescent intensities of CdS clusters in zeolite-Y on the CdS loading. [From W. Chen et al., J. Lumin. 71, 151 (1997).]
(400-600 nm) optical absorption spectra shown in Fig. 8.36 exhibit a shift to the red
(toward longer wavelengths) as the loading increases from 1 to 5% in zeolite-Y, as
expected from the increase in the average cluster size with greater loading. At 20%
loading the spectrum corresponds to that of bulk CdS, suggesting that some bulk
phase has formed outside the zeolite pores. The photoluminescence is low for low
CdS loading, increases in intensity as CdS is added, then falls off again for high
loadings, as shown in Fig. 8.37. In contrast to this, the thermoluminescence glow
curve intensity is highest for low loading, and decreases in intensity as the loading
increases, as indicated by the data presented in Figs. 8.34 and 8.37. This is explained
by the presence of trapped carriers introduced into the CdS clusters during sample
processing. These carriers are detrapped by the thermal energy added to the sample
near the temperature 375 K of the thermoluminescence peak in Fig. 8.34, the temperature where the thermal energy kBTequals the trap depth. The smaller clusters
associated with low loading have more surface states, and hence more electrons
to detrap and contribute to the glow peak. The increase in quantum confinement
characteristic of smaller clusters also contributes to the increase in recombination
probability, with the resulting enhanced thermoluminescence.
FURTHER READING
M.4. Baraton, “Fourier Transform Infrared Surface Spectrometry of Nano-Sized Particles,” in
W. Chen, “Fluorescence, Thermoluminescence, and Photostimulated Luminescence of NanoNalwa (ZOOO), Vol. 2, Chapter 2, p. 89.
particles,” in Nalwa (2000), Vol. 4, Chapter 5 , p. 325.