

E1C08 09/14/2010
14:53:57 Page 326
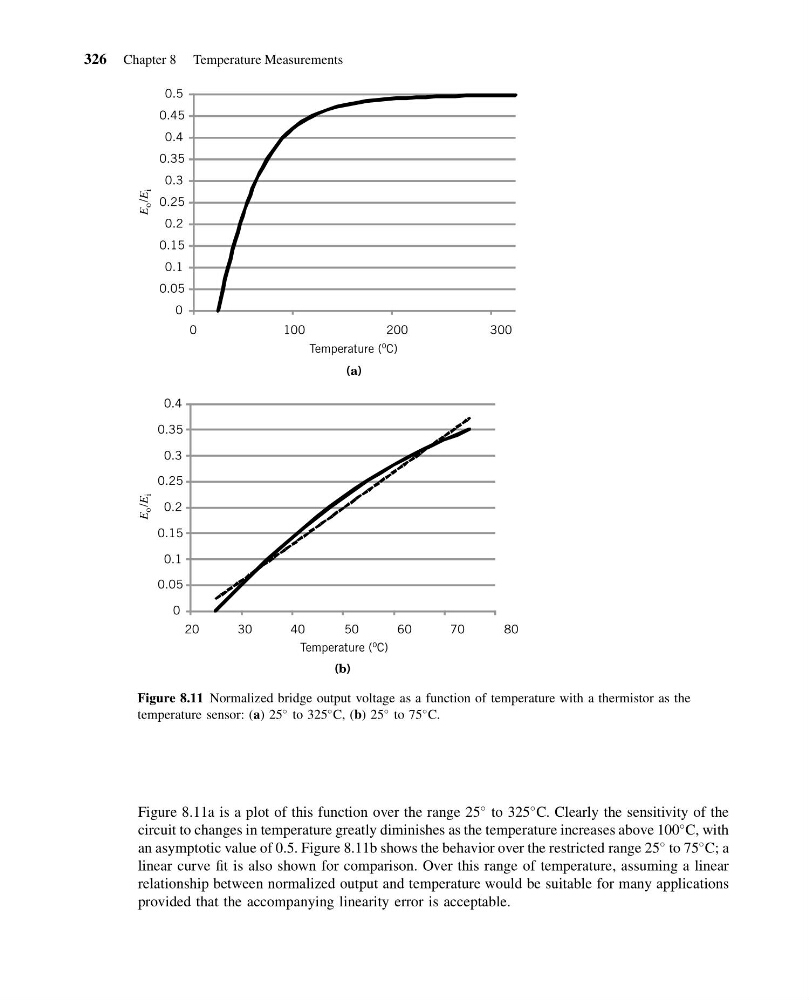
Figure 8.11a is a plot of this function over the range 25
to 325
C. Clearly the sensitivity of the
circuit to changes in temperature greatly diminishes as the temperature increases above 100
C, with
an asymptotic value of 0.5. Figure 8.11b shows the behavior over the restricted range 25
to 75
C; a
linear curve fit is also shown for comparison. Over this range of temperature, assuming a linear
relationship between normalized output and temperature would be suitable for many applications
provided that the accompanying linearity error is acceptable.
(a)
0
0.05
0.1
0.15
0.2
0.25
0.3
0.35
0.4
0.45
0.5
300
200
100
0
Temperature (
o C)
E
o /E
i
(b)
E
o /E
i
0
0.05
0.1
0.15
0.2
0.25
0.3
0.35
0.4
80
70
60
50
40
30
20
Temperature ( o C)
Figure 8.11 Normalized bridge output voltage as a function of temperature with a thermistor as the
temperature sensor: (a) 25
to 325
C, (b) 25
to 75
C.
326 Chapter 8 Temperature Measurements
14:53:57 Page 326
Figure 8.11a is a plot of this function over the range 25
to 325
C. Clearly the sensitivity of the
circuit to changes in temperature greatly diminishes as the temperature increases above 100
C, with
an asymptotic value of 0.5. Figure 8.11b shows the behavior over the restricted range 25
to 75
C; a
linear curve fit is also shown for comparison. Over this range of temperature, assuming a linear
relationship between normalized output and temperature would be suitable for many applications
provided that the accompanying linearity error is acceptable.
(a)
0
0.05
0.1
0.15
0.2
0.25
0.3
0.35
0.4
0.45
0.5
300
200
100
0
Temperature (
o C)
E
o /E
i
(b)
E
o /E
i
0
0.05
0.1
0.15
0.2
0.25
0.3
0.35
0.4
80
70
60
50
40
30
20
Temperature ( o C)
Figure 8.11 Normalized bridge output voltage as a function of temperature with a thermistor as the
temperature sensor: (a) 25
to 325
C, (b) 25
to 75
C.
326 Chapter 8 Temperature Measurements