

E1C01 09/14/2010
15:40:34 Page 15
1.4 CALIBRATION
A calibration applies a known input value to a measurement system for the purpose of observing the
system output value. It establishes the relationship between the input and output values. The known
value used for the calibration is called the standard.
Static Calibration
The most common type of calibration is known as a static calibration. In this procedure, a known
value is input to the system under calibration and the system output is recorded. The term ‘‘static’’
implies that the values of the variables involved remain constant; that is, they do not vary with time
or space. In static calibrations, only the magnitudes of the known input and the measured output are
important.
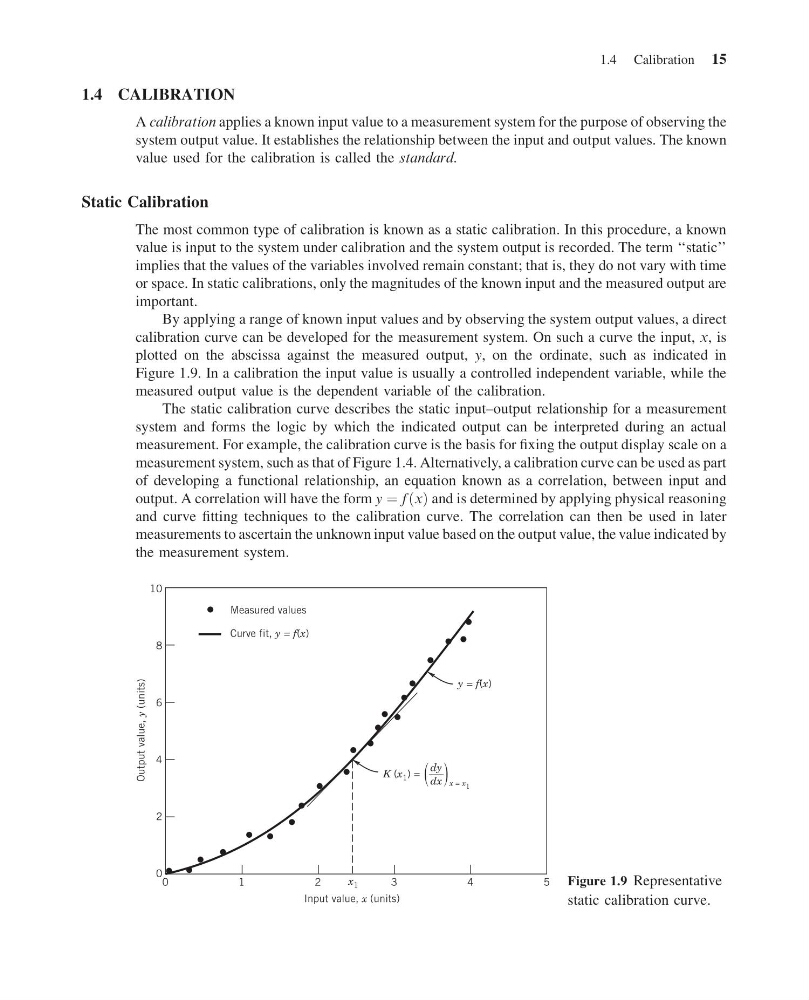
By applying a range of known input values and by observing the system output values, a direct
calibration curve can be developed for the measurement system. On such a curve the input, x, is
plotted on the abscissa against the measured output, y, on the ordinate, such as indicated in
Figure 1.9. In a calibration the input value is usually a controlled independent variable, while the
measured output value is the dependent variable of the calibration.
The static calibration curve describes the static input–output relationship for a measurement
system and forms the logic by which the indicated output can be interpreted during an actual
measurement. For example, the calibration curve is the basis for fixing the output display scale on a
measurement system, such as that of Figure 1.4. Alternatively, a calibration curve can be used as part
of developing a functional relationship, an equation known as a correlation, between input and
output. A correlation will have the form y ¼ f x
ð Þ and is determined by applying physical reasoning
and curve fitting techniques to the calibration curve. The correlation can then be used in later
measurements to ascertain the unknown input value based on the output value, the value indicated by
the measurement system.
2
1
0
Measured values
K (x 1 ) =
Curve fit, y = f(x)
y = f(x)
5
4
3
Input value, x (units)
x 1
Output value,
y (units)
0
2
4
6
8
10
dy
dx x = x 1
Figure 1.9 Representative
static calibration curve.
1.4 Calibration 15
15:40:34 Page 15
1.4 CALIBRATION
A calibration applies a known input value to a measurement system for the purpose of observing the
system output value. It establishes the relationship between the input and output values. The known
value used for the calibration is called the standard.
Static Calibration
The most common type of calibration is known as a static calibration. In this procedure, a known
value is input to the system under calibration and the system output is recorded. The term ‘‘static’’
implies that the values of the variables involved remain constant; that is, they do not vary with time
or space. In static calibrations, only the magnitudes of the known input and the measured output are
important.
By applying a range of known input values and by observing the system output values, a direct
calibration curve can be developed for the measurement system. On such a curve the input, x, is
plotted on the abscissa against the measured output, y, on the ordinate, such as indicated in
Figure 1.9. In a calibration the input value is usually a controlled independent variable, while the
measured output value is the dependent variable of the calibration.
The static calibration curve describes the static input–output relationship for a measurement
system and forms the logic by which the indicated output can be interpreted during an actual
measurement. For example, the calibration curve is the basis for fixing the output display scale on a
measurement system, such as that of Figure 1.4. Alternatively, a calibration curve can be used as part
of developing a functional relationship, an equation known as a correlation, between input and
output. A correlation will have the form y ¼ f x
ð Þ and is determined by applying physical reasoning
and curve fitting techniques to the calibration curve. The correlation can then be used in later
measurements to ascertain the unknown input value based on the output value, the value indicated by
the measurement system.
2
1
0
Measured values
K (x 1 ) =
Curve fit, y = f(x)
y = f(x)
5
4
3
Input value, x (units)
x 1
Output value,
y (units)
0
2
4
6
8
10
dy
dx x = x 1
Figure 1.9 Representative
static calibration curve.
1.4 Calibration 15