

E1C05 09/14/2010
14:36:30 Page 198
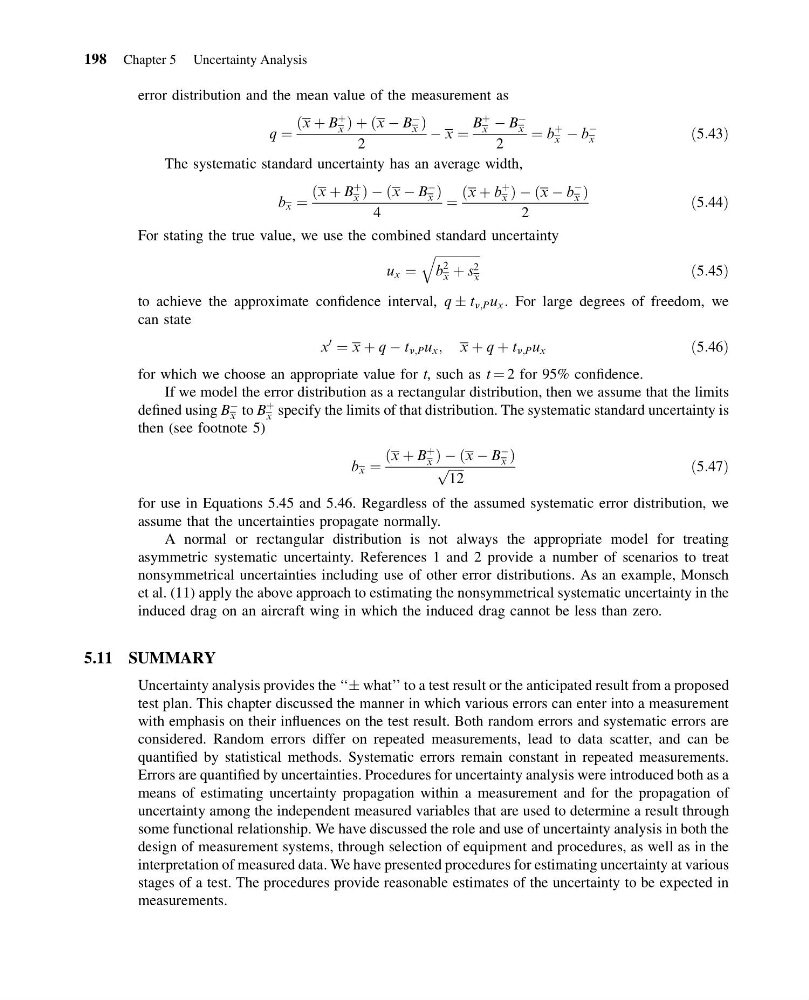
error distribution and the mean value of the measurement as
q ¼
ðx þ B
þ
x Þ þ ðx À B
À
x Þ
2
À x ¼
B
þ
x À B
À
x
2
¼ b
þ
x À b
À
x
ð5:43Þ
The systematic standard uncertainty has an average width,
b x ¼
ðx þ B
þ
x Þ À ðx À B
À
x Þ
4
¼
ðx þ b
þ
x Þ À ðx À b
À
x Þ
2
ð5:44Þ
For stating the true value, we use the combined standard uncertainty
u x ¼
ffiffiffiffiffiffiffiffiffiffiffiffiffiffi ffi
b
2
x þ s 2
x
q
ð5:45Þ
to achieve the approximate confidence interval, q Æ t n;P u x . For large degrees of freedom, we
can state
x
0
¼ x þ q À t n;P u x ; x þ q þ t n;P u x
ð5:46Þ
for which we choose an appropriate value for t, such as t ¼ 2 for 95% confidence.
If we model the error distribution as a rectangular distribution, then we assume that the limits
defined using B
À
x to B
þ
x specify the limits of that distribution. The systematic standard uncertainty is
then (see footnote 5)
b x ¼
ðx þ B
þ
x Þ À ðx À B
À
x Þ
ffiffiffiffiffi
12
p
ð5:47Þ
for use in Equations 5.45 and 5.46. Regardless of the assumed systematic error distribution, we
assume that the uncertainties propagate normally.
A normal or rectangular distribution is not always the appropriate model for treating
asymmetric systematic uncertainty. References 1 and 2 provide a number of scenarios to treat
nonsymmetrical uncertainties including use of other error distributions. As an example, Monsch
et al. (11) apply the above approach to estimating the nonsymmetrical systematic uncertainty in the
induced drag on an aircraft wing in which the induced drag cannot be less than zero.
5.11 SUMMARY
Uncertainty analysis provides the ‘‘Æ what’’ to a test result or the anticipated result from a proposed
test plan. This chapter discussed the manner in which various errors can enter into a measurement
with emphasis on their influences on the test result. Both random errors and systematic errors are
considered. Random errors differ on repeated measurements, lead to data scatter, and can be
quantified by statistical methods. Systematic errors remain constant in repeated measurements.
Errors are quantified by uncertainties. Procedures for uncertainty analysis were introduced both as a
means of estimating uncertainty propagation within a measurement and for the propagation of
uncertainty among the independent measured variables that are used to determine a result through
some functional relationship. We have discussed the role and use of uncertainty analysis in both the
design of measurement systems, through selection of equipment and procedures, as well as in the
interpretation of measured data. We have presented procedures for estimating uncertainty at various
stages of a test. The procedures provide reasonable estimates of the uncertainty to be expected in
measurements.
198 Chapter 5 Uncertainty Analysis
14:36:30 Page 198
error distribution and the mean value of the measurement as
q ¼
ðx þ B
þ
x Þ þ ðx À B
À
x Þ
2
À x ¼
B
þ
x À B
À
x
2
¼ b
þ
x À b
À
x
ð5:43Þ
The systematic standard uncertainty has an average width,
b x ¼
ðx þ B
þ
x Þ À ðx À B
À
x Þ
4
¼
ðx þ b
þ
x Þ À ðx À b
À
x Þ
2
ð5:44Þ
For stating the true value, we use the combined standard uncertainty
u x ¼
ffiffiffiffiffiffiffiffiffiffiffiffiffiffi ffi
b
2
x þ s 2
x
q
ð5:45Þ
to achieve the approximate confidence interval, q Æ t n;P u x . For large degrees of freedom, we
can state
x
0
¼ x þ q À t n;P u x ; x þ q þ t n;P u x
ð5:46Þ
for which we choose an appropriate value for t, such as t ¼ 2 for 95% confidence.
If we model the error distribution as a rectangular distribution, then we assume that the limits
defined using B
À
x to B
þ
x specify the limits of that distribution. The systematic standard uncertainty is
then (see footnote 5)
b x ¼
ðx þ B
þ
x Þ À ðx À B
À
x Þ
ffiffiffiffiffi
12
p
ð5:47Þ
for use in Equations 5.45 and 5.46. Regardless of the assumed systematic error distribution, we
assume that the uncertainties propagate normally.
A normal or rectangular distribution is not always the appropriate model for treating
asymmetric systematic uncertainty. References 1 and 2 provide a number of scenarios to treat
nonsymmetrical uncertainties including use of other error distributions. As an example, Monsch
et al. (11) apply the above approach to estimating the nonsymmetrical systematic uncertainty in the
induced drag on an aircraft wing in which the induced drag cannot be less than zero.
5.11 SUMMARY
Uncertainty analysis provides the ‘‘Æ what’’ to a test result or the anticipated result from a proposed
test plan. This chapter discussed the manner in which various errors can enter into a measurement
with emphasis on their influences on the test result. Both random errors and systematic errors are
considered. Random errors differ on repeated measurements, lead to data scatter, and can be
quantified by statistical methods. Systematic errors remain constant in repeated measurements.
Errors are quantified by uncertainties. Procedures for uncertainty analysis were introduced both as a
means of estimating uncertainty propagation within a measurement and for the propagation of
uncertainty among the independent measured variables that are used to determine a result through
some functional relationship. We have discussed the role and use of uncertainty analysis in both the
design of measurement systems, through selection of equipment and procedures, as well as in the
interpretation of measured data. We have presented procedures for estimating uncertainty at various
stages of a test. The procedures provide reasonable estimates of the uncertainty to be expected in
measurements.
198 Chapter 5 Uncertainty Analysis