

E1C05 09/14/2010
14:36:29 Page 194
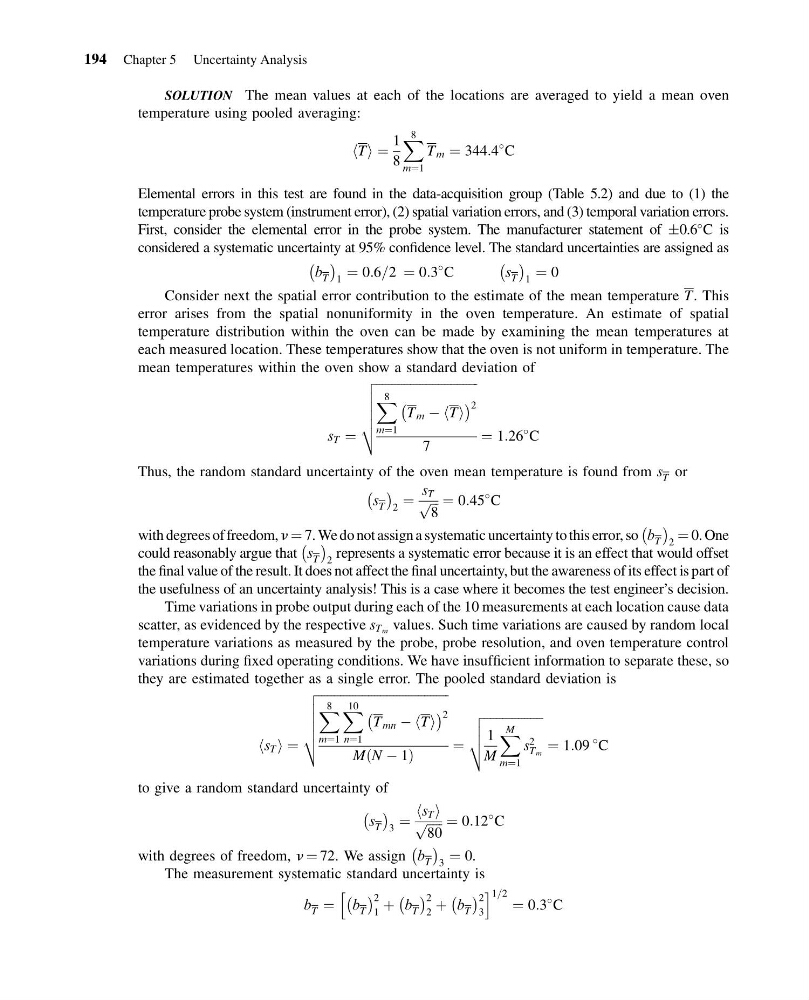
SOLUTION The mean values at each of the locations are averaged to yield a mean oven
temperature using pooled averaging:
hTi ¼
1
8
X 8
m¼1
T m ¼ 344:4
C
Elemental errors in this test are found in the data-acquisition group (Table 5.2) and due to (1) the
temperature probe system (instrument error), (2) spatial variation errors, and (3) temporal variation errors.
First, consider the elemental error in the probe system. The manufacturer statement of Æ0.6
C is
considered a systematic uncertainty at 95% confidence level. The standard uncertainties are assigned as
b T
À Á
1
¼ 0:6=2 ¼ 0:3
C
s T
À Á
1
¼ 0
Consider next the spatial error contribution to the estimate of the mean temperature T. This
error arises from the spatial nonuniformity in the oven temperature. An estimate of spatial
temperature distribution within the oven can be made by examining the mean temperatures at
each measured location. These temperatures show that the oven is not uniform in temperature. The
mean temperatures within the oven show a standard deviation of
s T ¼
ffiffiffiffiffiffiffiffiffiffiffiffiffiffiffiffiffiffiffiffiffiffiffiffiffiffiffiffiffiffiffiffi ffi
X 8
m¼1
T m À hTi
À
Á 2
7
v
u
u
u
u
t
¼ 1:26
C
Thus, the random standard uncertainty of the oven mean temperature is found from s T or
s T
À Á
2
¼
s T
ffiffi ffi
8
p ¼ 0:45
C
with degrees of freedom, n ¼ 7. We do not assign a systematic uncertainty to this error, so b T
À Á
2
¼ 0. One
could reasonably argue that s T
À Á
2
represents a systematic error because it is an effect that would offset
the final value of the result. It does not affect the final uncertainty, but the awareness of its effect is part of
the usefulness of an uncertainty analysis! This is a case where it becomes the test engineer’s decision.
Time variations in probe output during each of the 10 measurements at each location cause data
scatter, as evidenced by the respective s T m values. Such time variations are caused by random local
temperature variations as measured by the probe, probe resolution, and oven temperature control
variations during fixed operating conditions. We have insufficient information to separate these, so
they are estimated together as a single error. The pooled standard deviation is
hs T i ¼
ffiffiffiffiffiffiffiffiffiffiffiffiffiffiffiffiffiffiffiffiffiffiffiffiffiffiffiffiffiffiffiffiffiffiffiffiffiffiffiffiffiffi
X 8
m¼1
X 10
n¼1
T mn À hTi
À
Á 2
MðN À 1Þ
v
u
u
u
u
t
¼
ffiffiffiffiffiffiffiffiffiffiffiffiffiffiffiffiffiffiffi
1
M
X M
m¼1
s 2
T m
v
u
u
t
¼ 1:09
C
to give a random standard uncertainty of
s T
À Á
3
¼
hs T i
ffiffiffiffiffi
80
p ¼ 0:12
C
with degrees of freedom, n ¼ 72. We assign b T
À Á
3
¼ 0.
The measurement systematic standard uncertainty is
b T ¼ b T
À Á 2
1
þ b T
À Á 2
2
þ b T
À Á 2
3
h
i 1=2 ¼ 0:3
C
194 Chapter 5 Uncertainty Analysis
14:36:29 Page 194
SOLUTION The mean values at each of the locations are averaged to yield a mean oven
temperature using pooled averaging:
hTi ¼
1
8
X 8
m¼1
T m ¼ 344:4
C
Elemental errors in this test are found in the data-acquisition group (Table 5.2) and due to (1) the
temperature probe system (instrument error), (2) spatial variation errors, and (3) temporal variation errors.
First, consider the elemental error in the probe system. The manufacturer statement of Æ0.6
C is
considered a systematic uncertainty at 95% confidence level. The standard uncertainties are assigned as
b T
À Á
1
¼ 0:6=2 ¼ 0:3
C
s T
À Á
1
¼ 0
Consider next the spatial error contribution to the estimate of the mean temperature T. This
error arises from the spatial nonuniformity in the oven temperature. An estimate of spatial
temperature distribution within the oven can be made by examining the mean temperatures at
each measured location. These temperatures show that the oven is not uniform in temperature. The
mean temperatures within the oven show a standard deviation of
s T ¼
ffiffiffiffiffiffiffiffiffiffiffiffiffiffiffiffiffiffiffiffiffiffiffiffiffiffiffiffiffiffiffiffi ffi
X 8
m¼1
T m À hTi
À
Á 2
7
v
u
u
u
u
t
¼ 1:26
C
Thus, the random standard uncertainty of the oven mean temperature is found from s T or
s T
À Á
2
¼
s T
ffiffi ffi
8
p ¼ 0:45
C
with degrees of freedom, n ¼ 7. We do not assign a systematic uncertainty to this error, so b T
À Á
2
¼ 0. One
could reasonably argue that s T
À Á
2
represents a systematic error because it is an effect that would offset
the final value of the result. It does not affect the final uncertainty, but the awareness of its effect is part of
the usefulness of an uncertainty analysis! This is a case where it becomes the test engineer’s decision.
Time variations in probe output during each of the 10 measurements at each location cause data
scatter, as evidenced by the respective s T m values. Such time variations are caused by random local
temperature variations as measured by the probe, probe resolution, and oven temperature control
variations during fixed operating conditions. We have insufficient information to separate these, so
they are estimated together as a single error. The pooled standard deviation is
hs T i ¼
ffiffiffiffiffiffiffiffiffiffiffiffiffiffiffiffiffiffiffiffiffiffiffiffiffiffiffiffiffiffiffiffiffiffiffiffiffiffiffiffiffiffi
X 8
m¼1
X 10
n¼1
T mn À hTi
À
Á 2
MðN À 1Þ
v
u
u
u
u
t
¼
ffiffiffiffiffiffiffiffiffiffiffiffiffiffiffiffiffiffiffi
1
M
X M
m¼1
s 2
T m
v
u
u
t
¼ 1:09
C
to give a random standard uncertainty of
s T
À Á
3
¼
hs T i
ffiffiffiffiffi
80
p ¼ 0:12
C
with degrees of freedom, n ¼ 72. We assign b T
À Á
3
¼ 0.
The measurement systematic standard uncertainty is
b T ¼ b T
À Á 2
1
þ b T
À Á 2
2
þ b T
À Á 2
3
h
i 1=2 ¼ 0:3
C
194 Chapter 5 Uncertainty Analysis