

E1C05 09/14/2010
14:36:27 Page 185
provides guidance on assigning a value for n associated with judgment estimates of uncertainty.
When the degrees of freedoms in the systematic uncertainties are large, the second term in the
denominator of Equation 5.30 is small. For a 95% confidence level with large degrees of freedom, t
of 1.96 is assigned in Equation 5.29. This value can be conveniently rounded off to t ¼ 2 (i.e., two
standard deviations) (2).
Reference 1 prefers not to assign a probability level to an uncertainty statement but rather to
associate a value of the one, two, or three standard deviations, such as we do above for the standard
uncertainties. This accommodates different distribution functions and their respective probability
coverage in the expanded uncertainty interval. This reflects a difference between the two standards
(1, 2) and either approach is acceptable.
Example 5.8
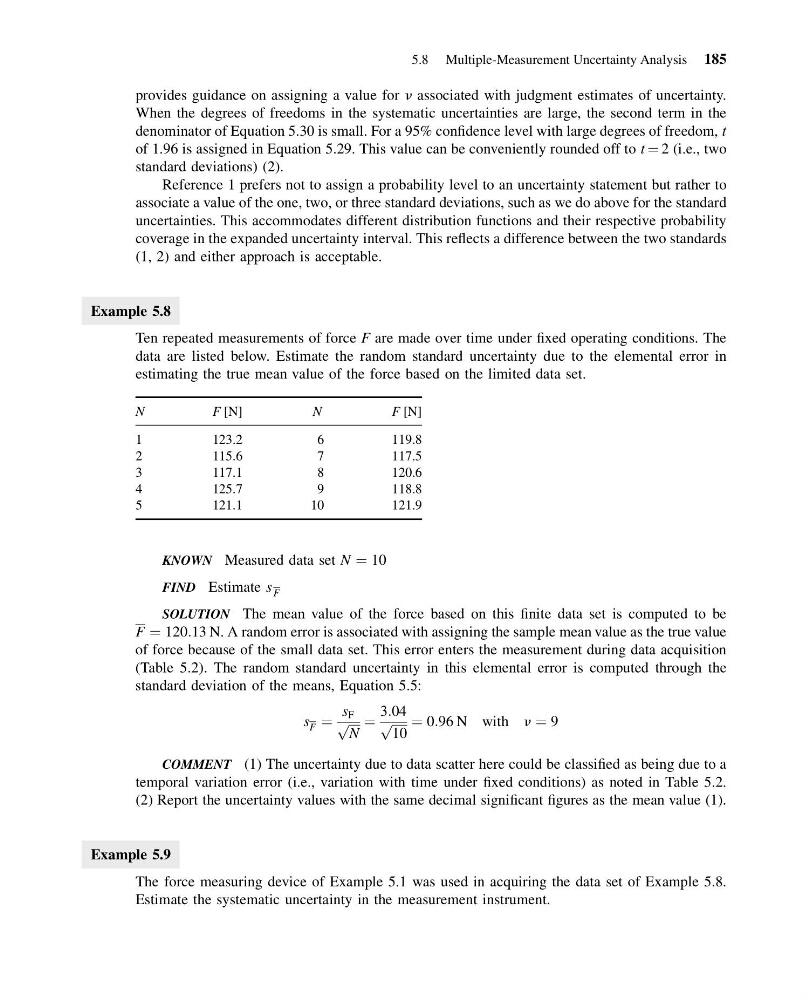
Ten repeated measurements of force F are made over time under fixed operating conditions. The
data are listed below. Estimate the random standard uncertainty due to the elemental error in
estimating the true mean value of the force based on the limited data set.
N
F [N]
N
F [N]
1
123.2
6
119.8
2
115.6
7
117.5
3
117.1
8
120.6
4
125.7
9
118.8
5
121.1
10
121.9
KNOWN Measured data set N ¼ 10
FIND Estimate s F
SOLUTION The mean value of the force based on this finite data set is computed to be
F ¼ 120:13 N. A random error is associated with assigning the sample mean value as the true value
of force because of the small data set. This error enters the measurement during data acquisition
(Table 5.2). The random standard uncertainty in this elemental error is computed through the
standard deviation of the means, Equation 5.5:
s F ¼
s F
ffiffiffiffi
N
p ¼
3:04
ffiffiffiffiffi
10
p ¼ 0:96 N with n ¼ 9
COMMENT (1) The uncertainty due to data scatter here could be classified as being due to a
temporal variation error (i.e., variation with time under fixed conditions) as noted in Table 5.2.
(2) Report the uncertainty values with the same decimal significant figures as the mean value (1).
Example 5.9
The force measuring device of Example 5.1 was used in acquiring the data set of Example 5.8.
Estimate the systematic uncertainty in the measurement instrument.
5.8 Multiple-Measurement Uncertainty Analysis 185
14:36:27 Page 185
provides guidance on assigning a value for n associated with judgment estimates of uncertainty.
When the degrees of freedoms in the systematic uncertainties are large, the second term in the
denominator of Equation 5.30 is small. For a 95% confidence level with large degrees of freedom, t
of 1.96 is assigned in Equation 5.29. This value can be conveniently rounded off to t ¼ 2 (i.e., two
standard deviations) (2).
Reference 1 prefers not to assign a probability level to an uncertainty statement but rather to
associate a value of the one, two, or three standard deviations, such as we do above for the standard
uncertainties. This accommodates different distribution functions and their respective probability
coverage in the expanded uncertainty interval. This reflects a difference between the two standards
(1, 2) and either approach is acceptable.
Example 5.8
Ten repeated measurements of force F are made over time under fixed operating conditions. The
data are listed below. Estimate the random standard uncertainty due to the elemental error in
estimating the true mean value of the force based on the limited data set.
N
F [N]
N
F [N]
1
123.2
6
119.8
2
115.6
7
117.5
3
117.1
8
120.6
4
125.7
9
118.8
5
121.1
10
121.9
KNOWN Measured data set N ¼ 10
FIND Estimate s F
SOLUTION The mean value of the force based on this finite data set is computed to be
F ¼ 120:13 N. A random error is associated with assigning the sample mean value as the true value
of force because of the small data set. This error enters the measurement during data acquisition
(Table 5.2). The random standard uncertainty in this elemental error is computed through the
standard deviation of the means, Equation 5.5:
s F ¼
s F
ffiffiffiffi
N
p ¼
3:04
ffiffiffiffiffi
10
p ¼ 0:96 N with n ¼ 9
COMMENT (1) The uncertainty due to data scatter here could be classified as being due to a
temporal variation error (i.e., variation with time under fixed conditions) as noted in Table 5.2.
(2) Report the uncertainty values with the same decimal significant figures as the mean value (1).
Example 5.9
The force measuring device of Example 5.1 was used in acquiring the data set of Example 5.8.
Estimate the systematic uncertainty in the measurement instrument.
5.8 Multiple-Measurement Uncertainty Analysis 185