

E1C04 09/14/2010
14:7:49 Page 156
4.21 Compare the reduction in the possible range of random error in estimating x
0 by taking a sample of 16
measurements as opposed to only four measurements. Then compare 100 measurements to 25.
Explain ‘‘diminishing returns’’ as it applies to using larger sample sizes to reduce random error in
estimating the true mean value.
4.22 The variance in the strength test values of 270 bricks is 6.89 (MN/m
2 )
2 with a mean of 6.92 MN/m
2 .
What is the random error in the mean value and the confidence interval at 95%?
4.23 During the course of a motor test, the motor rpm (revolutions per minute) is measured and recorded at
regular intervals as:
990
1030
950
1050
1000
980
Calculate the mean value, standard deviation and the best estimate of the true value for this data set.
Over what interval would 50% of the entire population of motor speed values fall? Test the data set
for potential outliers.
4.24 A batch of rivets is tested for shear strength. A sample of 31 rivets shows a mean strength of 924.2
MPa with a standard deviation of 18 MPa. Estimate of the mean shear strength for the batch at 95%
probability.
4.25 Three independent sets of data are collected from the population of a variable during similar process
operating condition. The statistics are found to be
N 1 ¼ 16; x 1 ¼ 32; s x 1 ¼ 3 units
N 2 ¼ 21; x 1 ¼ 30; s x 2 ¼ 2 units
N 3 ¼ 9; x 1 ¼ 34; s x 3 ¼ 6 units
Neglecting systematic errors and random errors other than the variation in the measured data set,
compute an estimate of the pooled mean value of this variable and the range in which the true mean
should lie with 95% confidence.
4.26 Eleven core samples of fresh concrete are taken by a county engineer from the loads of 11 concrete
trucks used in pouring a structural footing. After curing, the engineer tests to find a mean
compression strength of 3027 lb/in.
2 with a standard deviation of 53 lb/in.
2 . State codes require
a minimum strength of 3000 lb/in.
2 at 95% confidence. Should the footing be repoured based on a
95% confidence interval of the test data?
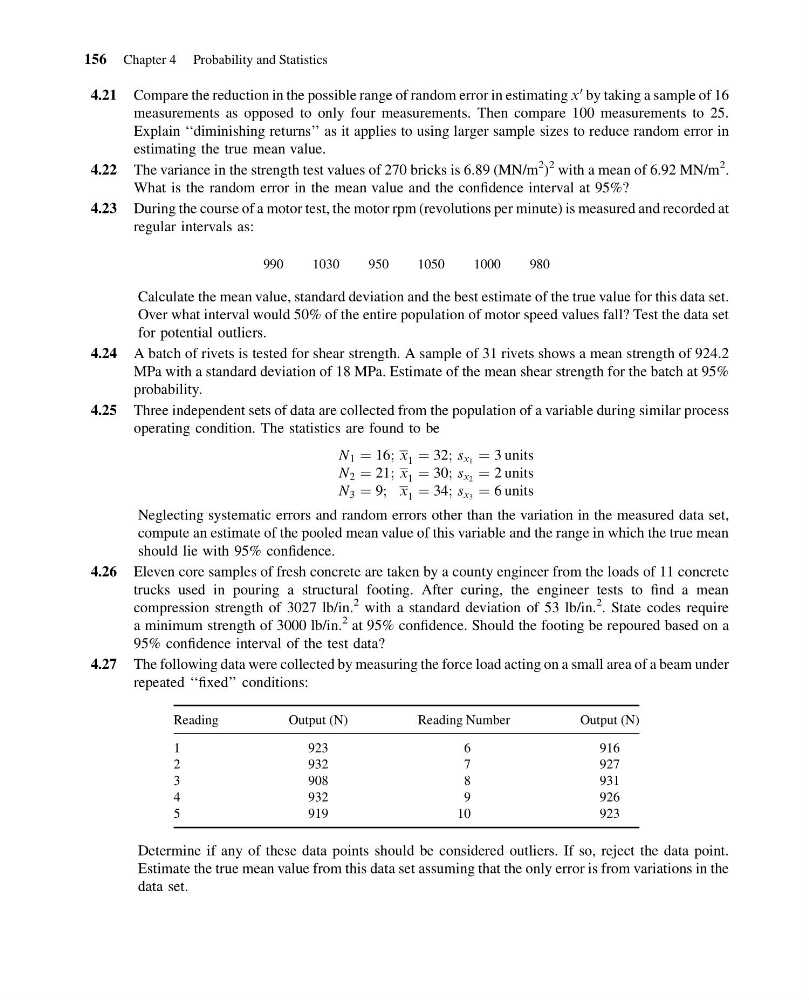
4.27 The following data were collected by measuring the force load acting on a small area of a beam under
repeated ‘‘fixed’’ conditions:
Reading
Output (N)
Reading Number
Output (N)
1
923
6
916
2
932
7
927
3
908
8
931
4
932
9
926
5
919
10
923
Determine if any of these data points should be considered outliers. If so, reject the data point.
Estimate the true mean value from this data set assuming that the only error is from variations in the
data set.
156 Chapter 4 Probability and Statistics
14:7:49 Page 156
4.21 Compare the reduction in the possible range of random error in estimating x
0 by taking a sample of 16
measurements as opposed to only four measurements. Then compare 100 measurements to 25.
Explain ‘‘diminishing returns’’ as it applies to using larger sample sizes to reduce random error in
estimating the true mean value.
4.22 The variance in the strength test values of 270 bricks is 6.89 (MN/m
2 )
2 with a mean of 6.92 MN/m
2 .
What is the random error in the mean value and the confidence interval at 95%?
4.23 During the course of a motor test, the motor rpm (revolutions per minute) is measured and recorded at
regular intervals as:
990
1030
950
1050
1000
980
Calculate the mean value, standard deviation and the best estimate of the true value for this data set.
Over what interval would 50% of the entire population of motor speed values fall? Test the data set
for potential outliers.
4.24 A batch of rivets is tested for shear strength. A sample of 31 rivets shows a mean strength of 924.2
MPa with a standard deviation of 18 MPa. Estimate of the mean shear strength for the batch at 95%
probability.
4.25 Three independent sets of data are collected from the population of a variable during similar process
operating condition. The statistics are found to be
N 1 ¼ 16; x 1 ¼ 32; s x 1 ¼ 3 units
N 2 ¼ 21; x 1 ¼ 30; s x 2 ¼ 2 units
N 3 ¼ 9; x 1 ¼ 34; s x 3 ¼ 6 units
Neglecting systematic errors and random errors other than the variation in the measured data set,
compute an estimate of the pooled mean value of this variable and the range in which the true mean
should lie with 95% confidence.
4.26 Eleven core samples of fresh concrete are taken by a county engineer from the loads of 11 concrete
trucks used in pouring a structural footing. After curing, the engineer tests to find a mean
compression strength of 3027 lb/in.
2 with a standard deviation of 53 lb/in.
2 . State codes require
a minimum strength of 3000 lb/in.
2 at 95% confidence. Should the footing be repoured based on a
95% confidence interval of the test data?
4.27 The following data were collected by measuring the force load acting on a small area of a beam under
repeated ‘‘fixed’’ conditions:
Reading
Output (N)
Reading Number
Output (N)
1
923
6
916
2
932
7
927
3
908
8
931
4
932
9
926
5
919
10
923
Determine if any of these data points should be considered outliers. If so, reject the data point.
Estimate the true mean value from this data set assuming that the only error is from variations in the
data set.
156 Chapter 4 Probability and Statistics