

E1C04 09/14/2010
14:7:49 Page 154
4.4 Consider the toss of four coins. There are 2
4 possible outcomes of a single toss. Develop a histogram
of the number of heads (one side of the coin) that can appear on any toss. Does it look like a normal
distribution? Should this be expected? What is the probability that three heads will appear on any
toss?
4.5 As a game, slide a matchbook across a table, trying to make it stop at some predefined point
on each attempt. Measure the distance from the starting point to the stopping point. Repeat
this 10, 20, through 50 times. Plot the frequency distribution from each set. Would you expect
them to look like a gaussian distribution? What statistical outcomes would distinguish a better
player?
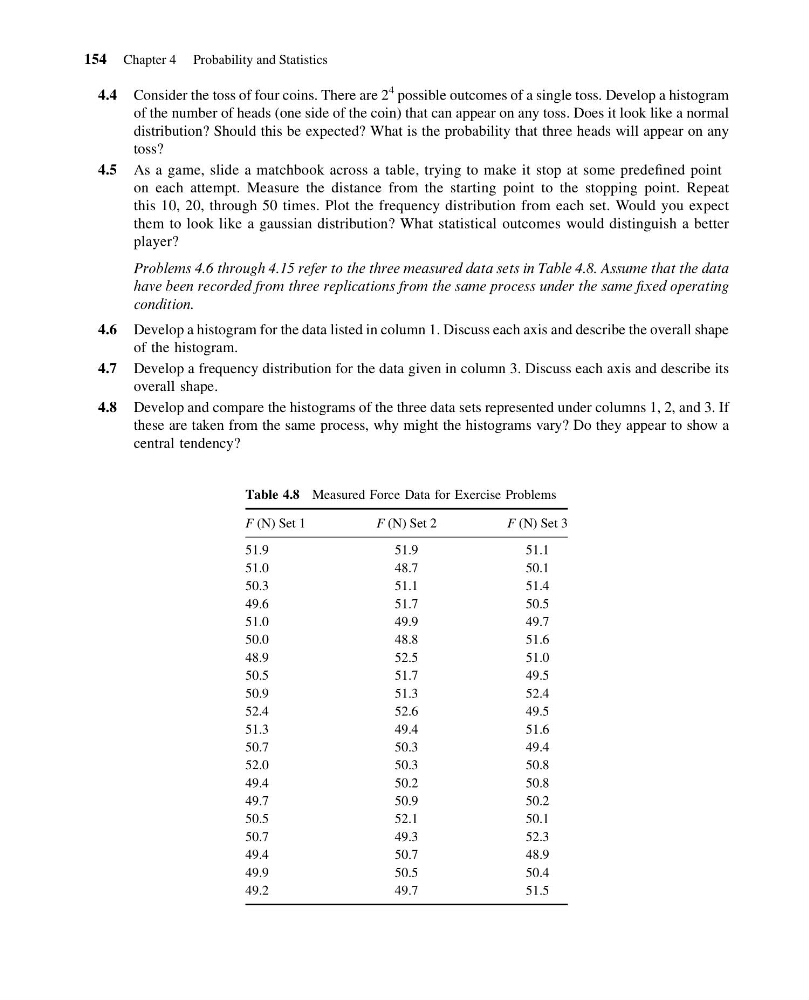
Problems 4.6 through 4.15 refer to the three measured data sets in Table 4.8. Assume that the data
have been recorded from three replications from the same process under the same fixed operating
condition.
4.6 Develop a histogram for the data listed in column 1. Discuss each axis and describe the overall shape
of the histogram.
4.7 Develop a frequency distribution for the data given in column 3. Discuss each axis and describe its
overall shape.
4.8 Develop and compare the histograms of the three data sets represented under columns 1, 2, and 3. If
these are taken from the same process, why might the histograms vary? Do they appear to show a
central tendency?
Table 4.8 Measured Force Data for Exercise Problems
F (N) Set 1
F (N) Set 2
F (N) Set 3
51.9
51.9
51.1
51.0
48.7
50.1
50.3
51.1
51.4
49.6
51.7
50.5
51.0
49.9
49.7
50.0
48.8
51.6
48.9
52.5
51.0
50.5
51.7
49.5
50.9
51.3
52.4
52.4
52.6
49.5
51.3
49.4
51.6
50.7
50.3
49.4
52.0
50.3
50.8
49.4
50.2
50.8
49.7
50.9
50.2
50.5
52.1
50.1
50.7
49.3
52.3
49.4
50.7
48.9
49.9
50.5
50.4
49.2
49.7
51.5
154 Chapter 4 Probability and Statistics
14:7:49 Page 154
4.4 Consider the toss of four coins. There are 2
4 possible outcomes of a single toss. Develop a histogram
of the number of heads (one side of the coin) that can appear on any toss. Does it look like a normal
distribution? Should this be expected? What is the probability that three heads will appear on any
toss?
4.5 As a game, slide a matchbook across a table, trying to make it stop at some predefined point
on each attempt. Measure the distance from the starting point to the stopping point. Repeat
this 10, 20, through 50 times. Plot the frequency distribution from each set. Would you expect
them to look like a gaussian distribution? What statistical outcomes would distinguish a better
player?
Problems 4.6 through 4.15 refer to the three measured data sets in Table 4.8. Assume that the data
have been recorded from three replications from the same process under the same fixed operating
condition.
4.6 Develop a histogram for the data listed in column 1. Discuss each axis and describe the overall shape
of the histogram.
4.7 Develop a frequency distribution for the data given in column 3. Discuss each axis and describe its
overall shape.
4.8 Develop and compare the histograms of the three data sets represented under columns 1, 2, and 3. If
these are taken from the same process, why might the histograms vary? Do they appear to show a
central tendency?
Table 4.8 Measured Force Data for Exercise Problems
F (N) Set 1
F (N) Set 2
F (N) Set 3
51.9
51.9
51.1
51.0
48.7
50.1
50.3
51.1
51.4
49.6
51.7
50.5
51.0
49.9
49.7
50.0
48.8
51.6
48.9
52.5
51.0
50.5
51.7
49.5
50.9
51.3
52.4
52.4
52.6
49.5
51.3
49.4
51.6
50.7
50.3
49.4
52.0
50.3
50.8
49.4
50.2
50.8
49.7
50.9
50.2
50.5
52.1
50.1
50.7
49.3
52.3
49.4
50.7
48.9
49.9
50.5
50.4
49.2
49.7
51.5
154 Chapter 4 Probability and Statistics