

E1C04 09/14/2010
14:7:44 Page 147
The polynomial is transformed back to the form E ¼ a þ bU
m :
E ¼ 3:19 þ 0:30 U
0:43
V
The curve fit with its 95% confidence interval is shown on Figure 4.11.
COMMENT In the present example, the intercept was chosen based on knowledge of the
measurement system.
4.7 DATA OUTLIER DETECTION
It is not uncommon to find a spurious data point that does not appear to fit the tendency of the data
set. Data that lie outside the probability of normal variation incorrectly offset the sample mean value
estimate, inflate the random uncertainty estimates, and influence a least-squares correlation.
Statistical techniques can be used to detect such data points, which are known as outliers. Outliers
may be the result of simple measurement glitches or may reflect a more fundamental problem with
test variable controls. Once detected, the decision to remove the data point from the data set must be
made carefully. Once outliers are removed from a data set, the statistics are recomputed using the
remaining data.
One approach to outlier detection is Chauvenet’s criterion, which identifies outliers having less
than a 1/2N probability of occurrence. To apply this criterion, let z 0 ¼ x i À x=s x j
j
where x i is a
suspected outlier in a data set of N values. In terms of the probability values of Table 4.3, the data
point is a potential outlier if
1 À 2 Â Pðz 0 Þ
ð
Þ< 1=2N
ð4:44Þ
For large data sets, another approach, the three-sigma test
7 , is to identify those data points that lie
outside the range of 99.73% probability of occurrence, x Æ t v;99:7 s x , as potential outliers. However,
either approach assumes that the sample set follows a normal distribution, which may not be true.
Other methods of outlier detection are discussed elsewhere (3, 7).
Example 4.11
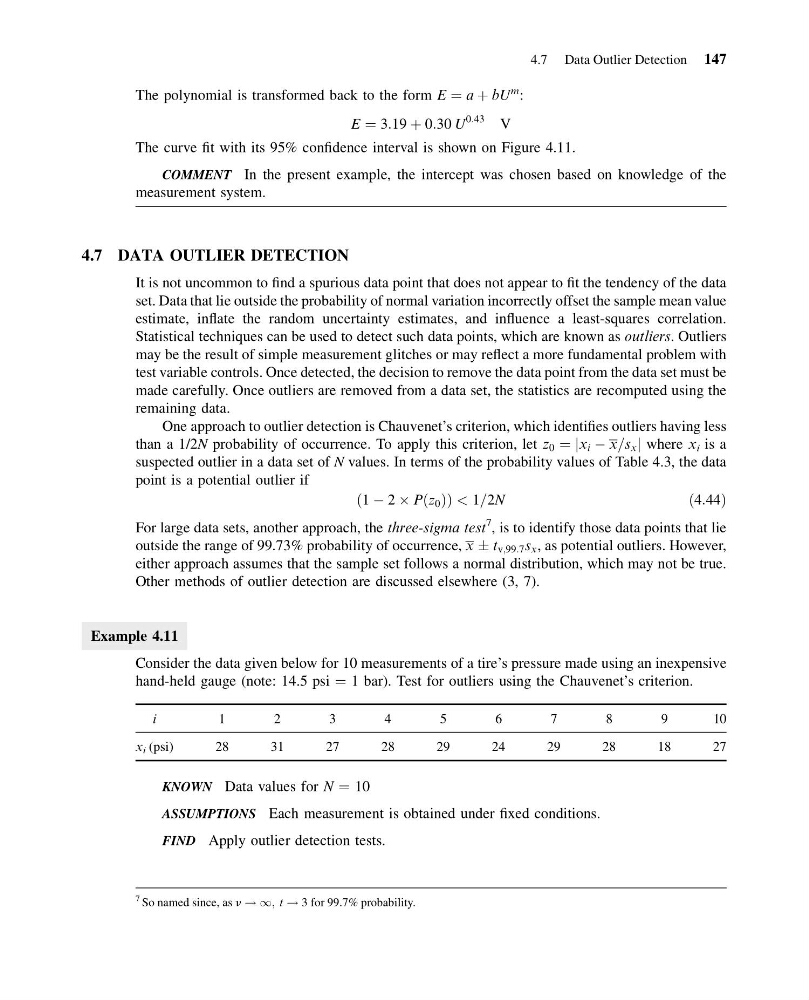
Consider the data given below for 10 measurements of a tire’s pressure made using an inexpensive
hand-held gauge (note: 14.5 psi ¼ 1 bar). Test for outliers using the Chauvenet’s criterion.
i
1
2
3
4
5
6
7
8
9
1 0
x i (psi)
28
31
27
28
29
24
29
28
18
27
KNOWN Data values for N ¼ 10
ASSUMPTIONS Each measurement is obtained under fixed conditions.
FIND Apply outlier detection tests.
7 So named since, as n ! 1; t ! 3 for 99.7% probability.
4.7 Data Outlier Detection 147
14:7:44 Page 147
The polynomial is transformed back to the form E ¼ a þ bU
m :
E ¼ 3:19 þ 0:30 U
0:43
V
The curve fit with its 95% confidence interval is shown on Figure 4.11.
COMMENT In the present example, the intercept was chosen based on knowledge of the
measurement system.
4.7 DATA OUTLIER DETECTION
It is not uncommon to find a spurious data point that does not appear to fit the tendency of the data
set. Data that lie outside the probability of normal variation incorrectly offset the sample mean value
estimate, inflate the random uncertainty estimates, and influence a least-squares correlation.
Statistical techniques can be used to detect such data points, which are known as outliers. Outliers
may be the result of simple measurement glitches or may reflect a more fundamental problem with
test variable controls. Once detected, the decision to remove the data point from the data set must be
made carefully. Once outliers are removed from a data set, the statistics are recomputed using the
remaining data.
One approach to outlier detection is Chauvenet’s criterion, which identifies outliers having less
than a 1/2N probability of occurrence. To apply this criterion, let z 0 ¼ x i À x=s x j
j
where x i is a
suspected outlier in a data set of N values. In terms of the probability values of Table 4.3, the data
point is a potential outlier if
1 À 2 Â Pðz 0 Þ
ð
Þ< 1=2N
ð4:44Þ
For large data sets, another approach, the three-sigma test
7 , is to identify those data points that lie
outside the range of 99.73% probability of occurrence, x Æ t v;99:7 s x , as potential outliers. However,
either approach assumes that the sample set follows a normal distribution, which may not be true.
Other methods of outlier detection are discussed elsewhere (3, 7).
Example 4.11
Consider the data given below for 10 measurements of a tire’s pressure made using an inexpensive
hand-held gauge (note: 14.5 psi ¼ 1 bar). Test for outliers using the Chauvenet’s criterion.
i
1
2
3
4
5
6
7
8
9
1 0
x i (psi)
28
31
27
28
29
24
29
28
18
27
KNOWN Data values for N ¼ 10
ASSUMPTIONS Each measurement is obtained under fixed conditions.
FIND Apply outlier detection tests.
7 So named since, as n ! 1; t ! 3 for 99.7% probability.
4.7 Data Outlier Detection 147