

E1C04 09/14/2010
14:7:42 Page 132
Standard Deviation of the Means
If we were to measure another two dozen of the bearings discussed in Section 4.1, we would expect
the statistics from this new sample of randomly selected bearings to differ somewhat from the
previous sample. This is simply due to the combined effects of a finite sample size and random
variation in bearing size from manufacturing tolerances. This difference is a random error brought
on by the finite-sized data sets. So how can we quantify how good our estimate is of the true mean
based on a calculated sample mean? That method is now discussed.
Suppose we were to take N measurements of x under fixed operating conditions. If we
duplicated this procedure M times, we would calculate somewhat different estimates of the sample
mean value and sample variance for each of the M data sets. Why? The chance occurrence of events
in any finite sample affects the estimate of sample statistics; this is easily demonstrated. From the M
replications of the N measurements, we could compute a set of mean values. We would find that the
mean values would themselves each be normally distributed about some central value. In fact,
regardless of the shape of p(x) assumed, the mean values obtained from M replications will follow a
normal distribution defined by pð xÞ.
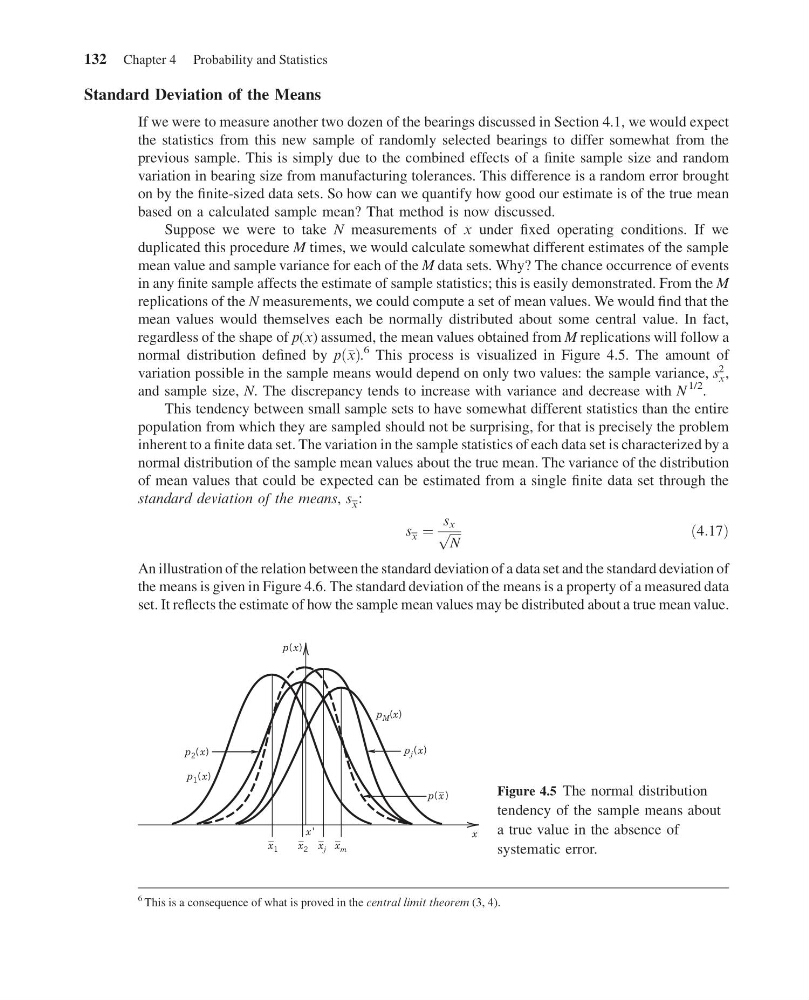
6 This process is visualized in Figure 4.5. The amount of
variation possible in the sample means would depend on only two values: the sample variance, s
2
x ,
and sample size, N. The discrepancy tends to increase with variance and decrease with N
1/2 .
This tendency between small sample sets to have somewhat different statistics than the entire
population from which they are sampled should not be surprising, for that is precisely the problem
inherent to a finite data set. The variation in the sample statistics of each data set is characterized by a
normal distribution of the sample mean values about the true mean. The variance of the distribution
of mean values that could be expected can be estimated from a single finite data set through the
standard deviation of the means, s x :
s x ¼
s x
ffiffiffiffi
N
p
ð4:17Þ
An illustration of the relation between the standard deviation of a data set and the standard deviation of
the means is given in Figure 4.6. The standard deviation of the means is a property of a measured data
set. It reflects the estimate of how the sample mean values may be distributed about a true mean value.
p( x)
p 2 ( x)
p j (x)
p M (x)
p( x)
–
p 1 ( x)
x 1
x'
x
–
x 2
– x j
– x m
–
Figure 4.5 The normal distribution
tendency of the sample means about
a true value in the absence of
systematic error.
6 This is a consequence of what is proved in the central limit theorem (3, 4).
132 Chapter 4 Probability and Statistics
14:7:42 Page 132
Standard Deviation of the Means
If we were to measure another two dozen of the bearings discussed in Section 4.1, we would expect
the statistics from this new sample of randomly selected bearings to differ somewhat from the
previous sample. This is simply due to the combined effects of a finite sample size and random
variation in bearing size from manufacturing tolerances. This difference is a random error brought
on by the finite-sized data sets. So how can we quantify how good our estimate is of the true mean
based on a calculated sample mean? That method is now discussed.
Suppose we were to take N measurements of x under fixed operating conditions. If we
duplicated this procedure M times, we would calculate somewhat different estimates of the sample
mean value and sample variance for each of the M data sets. Why? The chance occurrence of events
in any finite sample affects the estimate of sample statistics; this is easily demonstrated. From the M
replications of the N measurements, we could compute a set of mean values. We would find that the
mean values would themselves each be normally distributed about some central value. In fact,
regardless of the shape of p(x) assumed, the mean values obtained from M replications will follow a
normal distribution defined by pð xÞ.
6 This process is visualized in Figure 4.5. The amount of
variation possible in the sample means would depend on only two values: the sample variance, s
2
x ,
and sample size, N. The discrepancy tends to increase with variance and decrease with N
1/2 .
This tendency between small sample sets to have somewhat different statistics than the entire
population from which they are sampled should not be surprising, for that is precisely the problem
inherent to a finite data set. The variation in the sample statistics of each data set is characterized by a
normal distribution of the sample mean values about the true mean. The variance of the distribution
of mean values that could be expected can be estimated from a single finite data set through the
standard deviation of the means, s x :
s x ¼
s x
ffiffiffiffi
N
p
ð4:17Þ
An illustration of the relation between the standard deviation of a data set and the standard deviation of
the means is given in Figure 4.6. The standard deviation of the means is a property of a measured data
set. It reflects the estimate of how the sample mean values may be distributed about a true mean value.
p( x)
p 2 ( x)
p j (x)
p M (x)
p( x)
–
p 1 ( x)
x 1
x'
x
–
x 2
– x j
– x m
–
Figure 4.5 The normal distribution
tendency of the sample means about
a true value in the absence of
systematic error.
6 This is a consequence of what is proved in the central limit theorem (3, 4).
132 Chapter 4 Probability and Statistics