

E1C04 09/14/2010
14:7:41 Page 128
curve, p(x), defined by the interval x
0
À z 1 s
x
x
0
þ z 1 s, provides the probability that a
measurement will assume a value within that interval. Direct integration of p(x) for a normal
distribution between the limits x
0
Æ z 1 s yields that for z 1 ¼ 1, 68.26% of the area under p(x) lies
within Æ1s of x
0 . This means that there is a 68.26% chance that a measurement of x will have a
value within the interval x
0
Æ 1s. As the interval defined by z 1 is increased, the probability of
occurrence increases. For
z 1 ¼ 1; 68:26% of the area under pðxÞ lies within Æ z 1 s of x
0
:
z 1 ¼ 2; 95:45% of the area under pðxÞ lies within Æ z 1 s of x
0
:
z 1 ¼ 3; 99:73% of the area under pðxÞ lies within Æ z 1 s of x
0
:
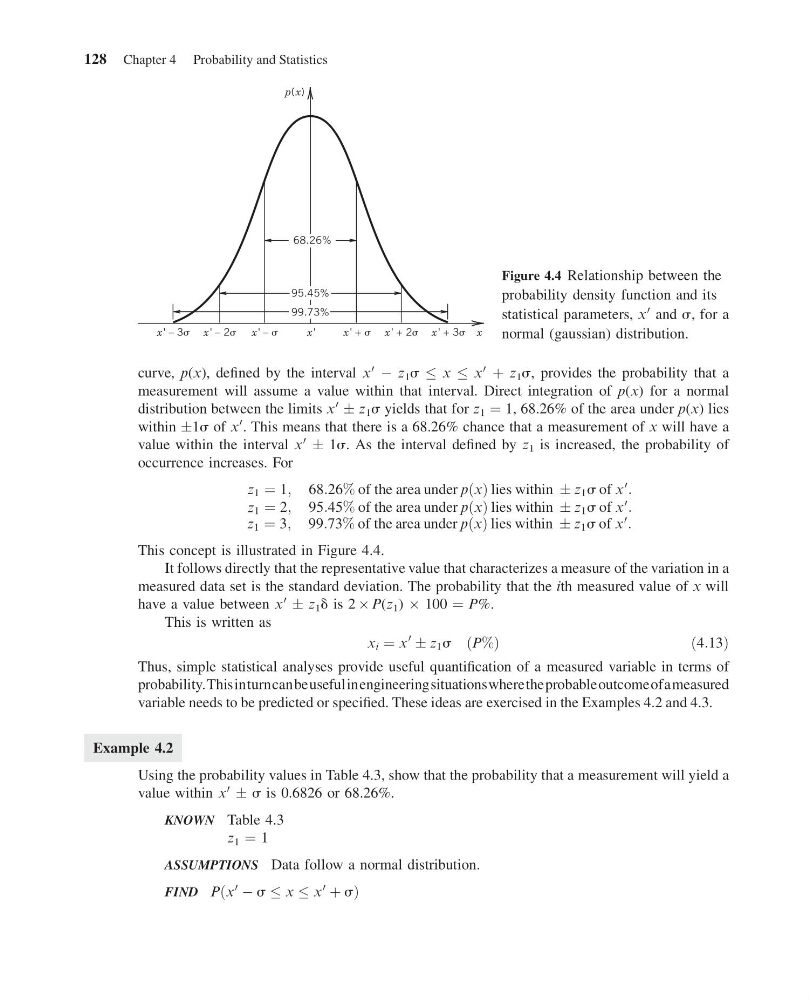
This concept is illustrated in Figure 4.4.
It follows directly that the representative value that characterizes a measure of the variation in a
measured data set is the standard deviation. The probability that the ith measured value of x will
have a value between x
0
Æ z 1 d is 2 Â P(z 1 ) Â 100 ¼ P%.
This is written as
x i ¼ x
0
Æ z 1 s ðP%Þ
ð 4:13Þ
Thus, simple statistical analyses provide useful quantification of a measured variable in terms of
probability.Thisinturncanbeusefulinengineeringsituationswheretheprobableoutcomeofameasured
variable needs to be predicted or specified. These ideas are exercised in the Examples 4.2 and 4.3.
Example 4.2
Using the probability values in Table 4.3, show that the probability that a measurement will yield a
value within x
0
Æ s is 0.6826 or 68.26%.
KNOWN Table 4.3
z 1 ¼ 1
ASSUMPTIONS Data follow a normal distribution.
FIND P x
0
À s x x
0
þ s
ð
Þ
p( x)
x' – 3
x' + 3
x
x' – 2
x' + 2
x' –
x' +
x'
99.73%
95.45%
68.26%
Figure 4.4 Relationship between the
probability density function and its
statistical parameters, x
0 and s, for a
normal (gaussian) distribution.
128 Chapter 4 Probability and Statistics
14:7:41 Page 128
curve, p(x), defined by the interval x
0
À z 1 s
x
x
0
þ z 1 s, provides the probability that a
measurement will assume a value within that interval. Direct integration of p(x) for a normal
distribution between the limits x
0
Æ z 1 s yields that for z 1 ¼ 1, 68.26% of the area under p(x) lies
within Æ1s of x
0 . This means that there is a 68.26% chance that a measurement of x will have a
value within the interval x
0
Æ 1s. As the interval defined by z 1 is increased, the probability of
occurrence increases. For
z 1 ¼ 1; 68:26% of the area under pðxÞ lies within Æ z 1 s of x
0
:
z 1 ¼ 2; 95:45% of the area under pðxÞ lies within Æ z 1 s of x
0
:
z 1 ¼ 3; 99:73% of the area under pðxÞ lies within Æ z 1 s of x
0
:
This concept is illustrated in Figure 4.4.
It follows directly that the representative value that characterizes a measure of the variation in a
measured data set is the standard deviation. The probability that the ith measured value of x will
have a value between x
0
Æ z 1 d is 2 Â P(z 1 ) Â 100 ¼ P%.
This is written as
x i ¼ x
0
Æ z 1 s ðP%Þ
ð 4:13Þ
Thus, simple statistical analyses provide useful quantification of a measured variable in terms of
probability.Thisinturncanbeusefulinengineeringsituationswheretheprobableoutcomeofameasured
variable needs to be predicted or specified. These ideas are exercised in the Examples 4.2 and 4.3.
Example 4.2
Using the probability values in Table 4.3, show that the probability that a measurement will yield a
value within x
0
Æ s is 0.6826 or 68.26%.
KNOWN Table 4.3
z 1 ¼ 1
ASSUMPTIONS Data follow a normal distribution.
FIND P x
0
À s x x
0
þ s
ð
Þ
p( x)
x' – 3
x' + 3
x
x' – 2
x' + 2
x' –
x' +
x'
99.73%
95.45%
68.26%
Figure 4.4 Relationship between the
probability density function and its
statistical parameters, x
0 and s, for a
normal (gaussian) distribution.
128 Chapter 4 Probability and Statistics