

E1C03 09/14/2010
15:24:53 Page 101
System Characteristics
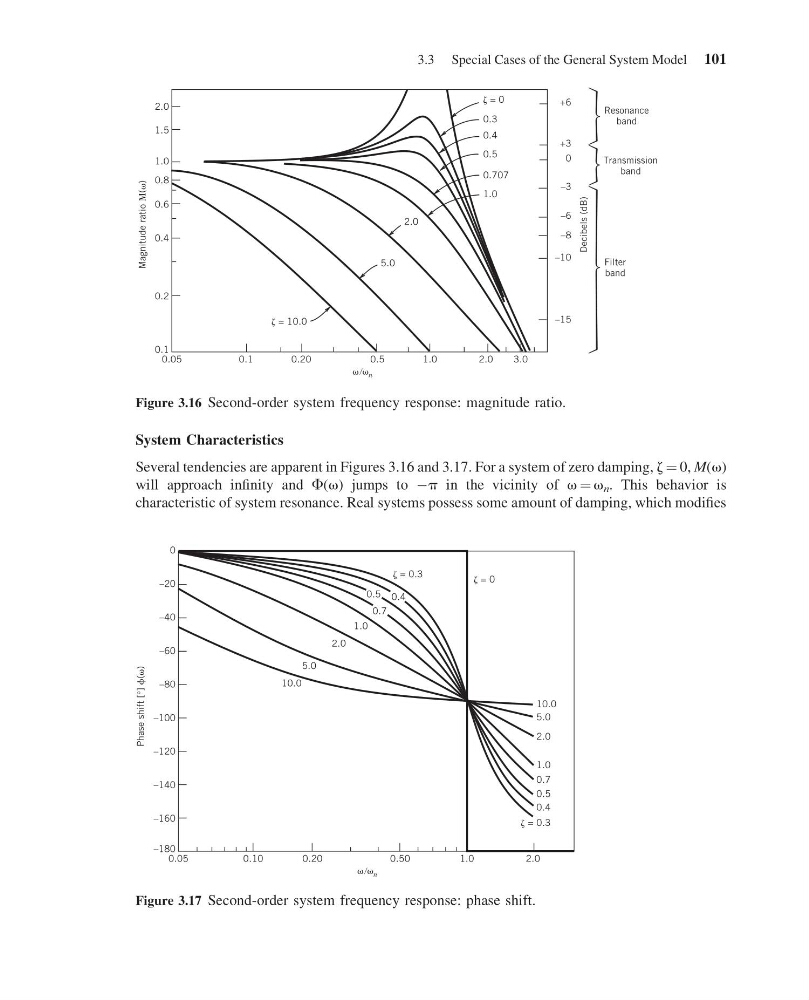
Several tendencies are apparent in Figures 3.16 and 3.17. For a system of zero damping, z ¼ 0, M(v)
will approach infinity and F(v) jumps to Àp in the vicinity of v ¼ v n . This behavior is
characteristic of system resonance. Real systems possess some amount of damping, which modifies
0.05
0.1
0.20
0.5
1.0
2.0
3.0
–15
Filter
band
= 0
= 10.0
0.3
0.4
0.5
0.707
1.0
2.0
5.0
Transmission
band
Resonance
band
–10
–8
–6
–3
0
+3
+6
n
Magnitude ratio ( )
Decibels (dB)
0.2
0.1
0.4
0.6
0.8
1.0
1.5
2.0
Figure 3.16 Second-order system frequency response: magnitude ratio.
0.05
0.10
0.20
0.50
1.0
2.0
= 0
= 0.3
= 0.3
n
Phase shift [°] ( )
–180
–160
–140
–120
–100
–80
–60
–40
–20
0
0.4
0.4
0.5
0.5
0.7
0.7
1.0
1.0
2.0
2.0
5.0
5.0
10.0
10.0
Figure 3.17 Second-order system frequency response: phase shift.
3.3 Special Cases of the General System Model 101
15:24:53 Page 101
System Characteristics
Several tendencies are apparent in Figures 3.16 and 3.17. For a system of zero damping, z ¼ 0, M(v)
will approach infinity and F(v) jumps to Àp in the vicinity of v ¼ v n . This behavior is
characteristic of system resonance. Real systems possess some amount of damping, which modifies
0.05
0.1
0.20
0.5
1.0
2.0
3.0
–15
Filter
band
= 0
= 10.0
0.3
0.4
0.5
0.707
1.0
2.0
5.0
Transmission
band
Resonance
band
–10
–8
–6
–3
0
+3
+6
n
Magnitude ratio ( )
Decibels (dB)
0.2
0.1
0.4
0.6
0.8
1.0
1.5
2.0
Figure 3.16 Second-order system frequency response: magnitude ratio.
0.05
0.10
0.20
0.50
1.0
2.0
= 0
= 0.3
= 0.3
n
Phase shift [°] ( )
–180
–160
–140
–120
–100
–80
–60
–40
–20
0
0.4
0.4
0.5
0.5
0.7
0.7
1.0
1.0
2.0
2.0
5.0
5.0
10.0
10.0
Figure 3.17 Second-order system frequency response: phase shift.
3.3 Special Cases of the General System Model 101