

E1C03 09/14/2010
15:24:52 Page 91
SOLUTION The percent response of the system is given by 1 À G
ð
ÞÂ100 with the error
fraction, G, defined by Equation 3.6. From Equation 3.5, we note that at t ¼ t, the thermometer will
indicate T(t) ¼ 30.75
C, which represents only 63.2% of the step change from 20
to 37
C. The 90%
rise time represents the time required for G to drop to a value of 0.10. Then
G ¼ 0:10 ¼ e
Àt=t
or t/t ¼ 2.3.
COMMENT In general, a time equivalent to 2.3t is required to achieve 90% of the applied step
input for a first-order system.
Example 3.5
A particular thermometer is subjected to a step change, such as in Example 3.3, in an experimental
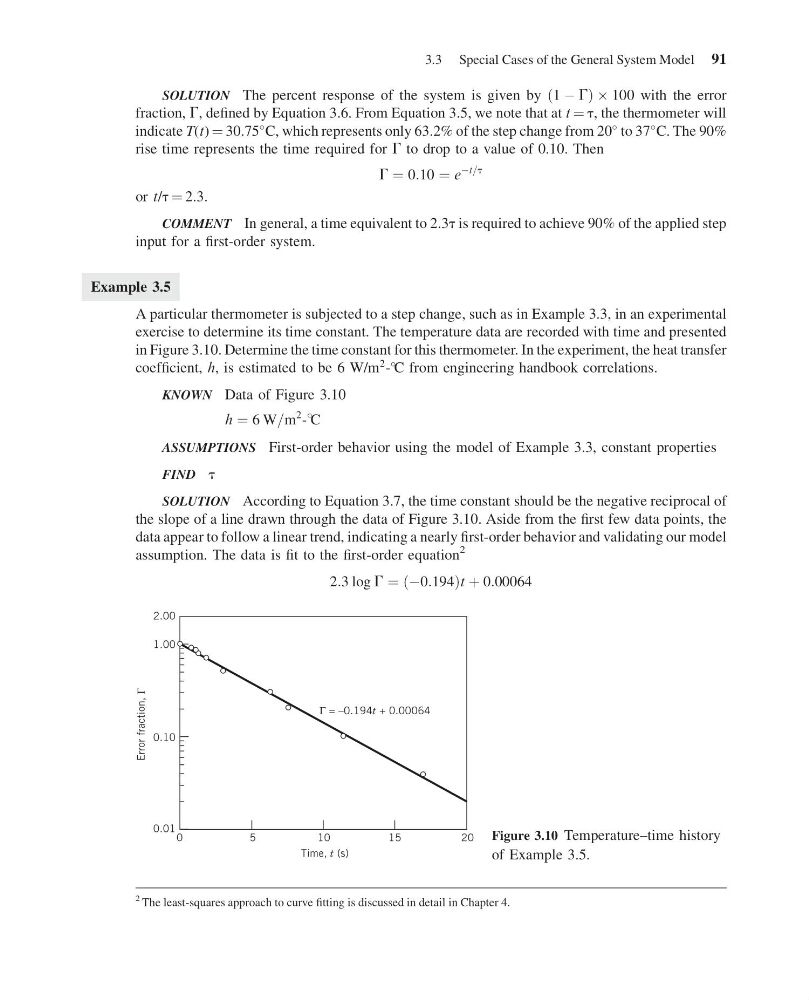
exercise to determine its time constant. The temperature data are recorded with time and presented
in Figure 3.10. Determine the time constant for this thermometer. In the experiment, the heat transfer
coefficient, h, is estimated to be 6 W/m
2 -
C from engineering handbook correlations.
KNOWN Data of Figure 3.10
h ¼ 6 W=m
2 -
C
ASSUMPTIONS First-order behavior using the model of Example 3.3, constant properties
FIND t
SOLUTION According to Equation 3.7, the time constant should be the negative reciprocal of
the slope of a line drawn through the data of Figure 3.10. Aside from the first few data points, the
data appear to follow a linear trend, indicating a nearly first-order behavior and validating our model
assumption. The data is fit to the first-order equation
2
2:3 log G ¼ ðÀ0:194Þt þ 0:00064
0
Time, t (s)
0.01
0.10
2.00
1.00
5
1 0
Γ = –0.194t + 0.00064
15
20
Error fraction,
Γ
Figure 3.10 Temperature–time history
of Example 3.5.
2 The least-squares approach to curve fitting is discussed in detail in Chapter 4.
3.3 Special Cases of the General System Model 91
15:24:52 Page 91
SOLUTION The percent response of the system is given by 1 À G
ð
ÞÂ100 with the error
fraction, G, defined by Equation 3.6. From Equation 3.5, we note that at t ¼ t, the thermometer will
indicate T(t) ¼ 30.75
C, which represents only 63.2% of the step change from 20
to 37
C. The 90%
rise time represents the time required for G to drop to a value of 0.10. Then
G ¼ 0:10 ¼ e
Àt=t
or t/t ¼ 2.3.
COMMENT In general, a time equivalent to 2.3t is required to achieve 90% of the applied step
input for a first-order system.
Example 3.5
A particular thermometer is subjected to a step change, such as in Example 3.3, in an experimental
exercise to determine its time constant. The temperature data are recorded with time and presented
in Figure 3.10. Determine the time constant for this thermometer. In the experiment, the heat transfer
coefficient, h, is estimated to be 6 W/m
2 -
C from engineering handbook correlations.
KNOWN Data of Figure 3.10
h ¼ 6 W=m
2 -
C
ASSUMPTIONS First-order behavior using the model of Example 3.3, constant properties
FIND t
SOLUTION According to Equation 3.7, the time constant should be the negative reciprocal of
the slope of a line drawn through the data of Figure 3.10. Aside from the first few data points, the
data appear to follow a linear trend, indicating a nearly first-order behavior and validating our model
assumption. The data is fit to the first-order equation
2
2:3 log G ¼ ðÀ0:194Þt þ 0:00064
0
Time, t (s)
0.01
0.10
2.00
1.00
5
1 0
Γ = –0.194t + 0.00064
15
20
Error fraction,
Γ
Figure 3.10 Temperature–time history
of Example 3.5.
2 The least-squares approach to curve fitting is discussed in detail in Chapter 4.
3.3 Special Cases of the General System Model 91