

102
2 Macroscopic Thermodynamics
Equations of this type are referred to as virial equations of state, and the coefficients
in the expansion are referred to as the second, third, etc., pressure or density
virial coefficients. A comparison between Eqs. (2.8.11a) and (2.8.10b), for example,
shows that the compressibility factor Z(P , T ) is given by
Z(P , T ) = 1 + B
2 (T )P + B
3 (T )P
2
+ · · · .
(2.8.12)
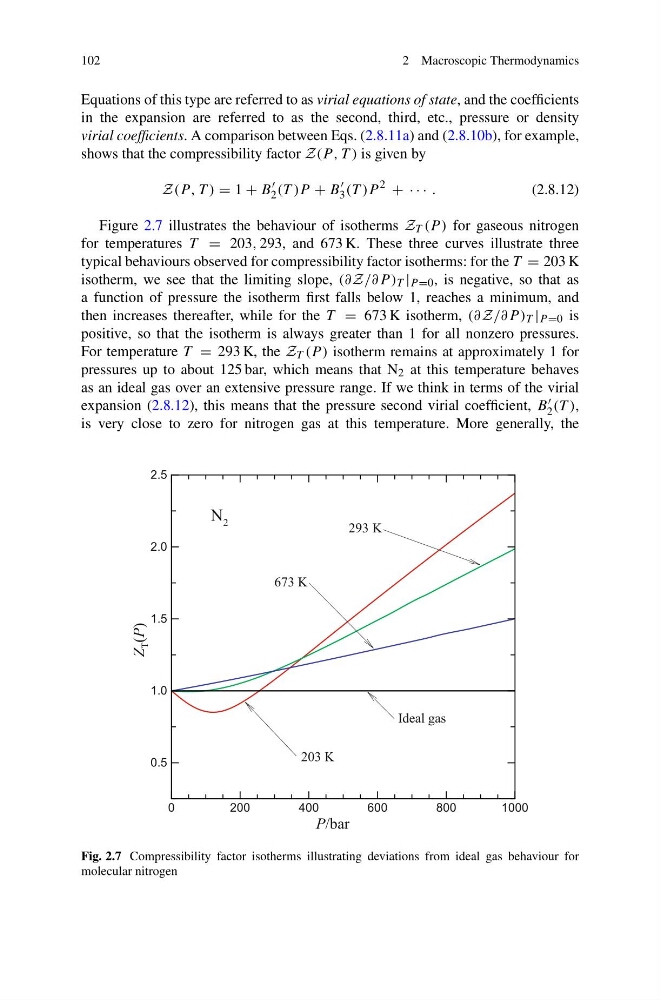
Figure 2.7 illustrates the behaviour of isotherms Z T (P ) for gaseous nitrogen
for temperatures T = 203, 293, and 673 K. These three curves illustrate three
typical behaviours observed for compressibility factor isotherms: for the T = 203 K
isotherm, we see that the limiting slope, (∂Z/∂P ) T | P =0 , is negative, so that as
a function of pressure the isotherm first falls below 1, reaches a minimum, and
then increases thereafter, while for the T = 673 K isotherm, (∂Z/∂P ) T | P =0 is
positive, so that the isotherm is always greater than 1 for all nonzero pressures.
For temperature T = 293 K, the Z T (P ) isotherm remains at approximately 1 for
pressures up to about 125 bar, which means that N 2 at this temperature behaves
as an ideal gas over an extensive pressure range. If we think in terms of the virial
expansion (2.8.12), this means that the pressure second virial coefficient, B
2 (T ),
is very close to zero for nitrogen gas at this temperature. More generally, the
0
200
400
600
800
1000
0.5
1.0
1.5
2.0
2.5
P/bar
Z
T (P)
203 K
293 K
673 K
N 2
Ideal gas
Fig. 2.7 Compressibility factor isotherms illustrating deviations from ideal gas behaviour for
molecular nitrogen
2 Macroscopic Thermodynamics
Equations of this type are referred to as virial equations of state, and the coefficients
in the expansion are referred to as the second, third, etc., pressure or density
virial coefficients. A comparison between Eqs. (2.8.11a) and (2.8.10b), for example,
shows that the compressibility factor Z(P , T ) is given by
Z(P , T ) = 1 + B
2 (T )P + B
3 (T )P
2
+ · · · .
(2.8.12)
Figure 2.7 illustrates the behaviour of isotherms Z T (P ) for gaseous nitrogen
for temperatures T = 203, 293, and 673 K. These three curves illustrate three
typical behaviours observed for compressibility factor isotherms: for the T = 203 K
isotherm, we see that the limiting slope, (∂Z/∂P ) T | P =0 , is negative, so that as
a function of pressure the isotherm first falls below 1, reaches a minimum, and
then increases thereafter, while for the T = 673 K isotherm, (∂Z/∂P ) T | P =0 is
positive, so that the isotherm is always greater than 1 for all nonzero pressures.
For temperature T = 293 K, the Z T (P ) isotherm remains at approximately 1 for
pressures up to about 125 bar, which means that N 2 at this temperature behaves
as an ideal gas over an extensive pressure range. If we think in terms of the virial
expansion (2.8.12), this means that the pressure second virial coefficient, B
2 (T ),
is very close to zero for nitrogen gas at this temperature. More generally, the
0
200
400
600
800
1000
0.5
1.0
1.5
2.0
2.5
P/bar
Z
T (P)
203 K
293 K
673 K
N 2
Ideal gas
Fig. 2.7 Compressibility factor isotherms illustrating deviations from ideal gas behaviour for
molecular nitrogen