

4.6 Molecular
Mobility and Phase
Separation
DSC can also be used to study molecular mobility and relaxation.
Molecular mobility is related to the shelf life of preserved materials
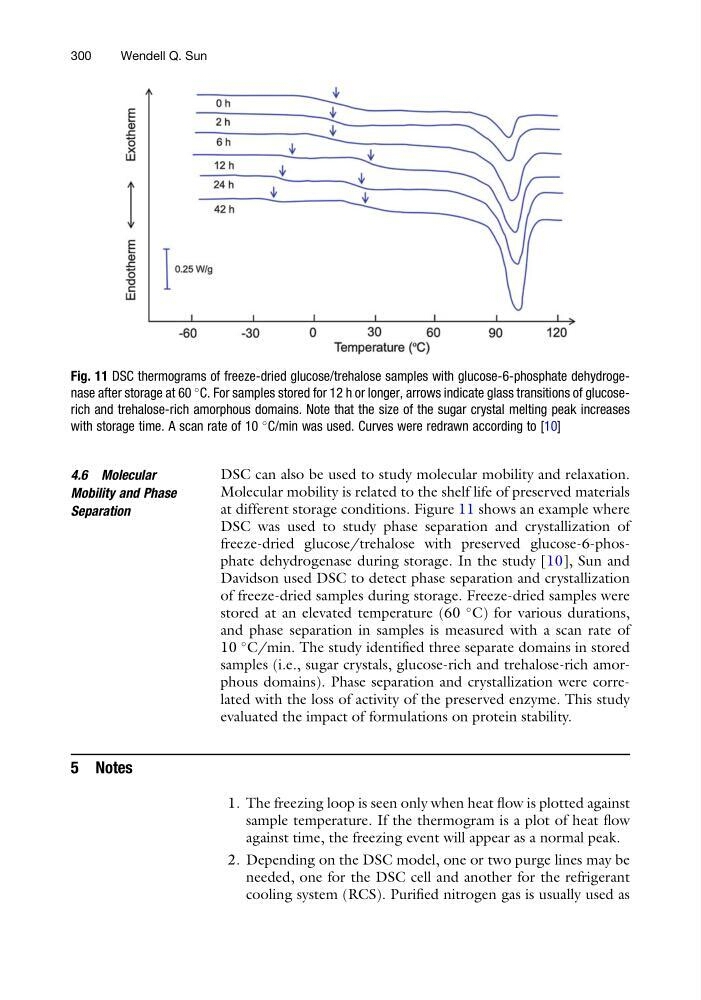
at different storage conditions. Figure 11 shows an example where
DSC was used to study phase separation and crystallization of
freeze-dried glucose/trehalose with preserved glucose-6-phosphate dehydrogenase during storage. In the study [10], Sun and
Davidson used DSC to detect phase separation and crystallization
of freeze-dried samples during storage. Freeze-dried samples were
stored at an elevated temperature (60
C) for various durations,
and phase separation in samples is measured with a scan rate of
10
C/min. The study identified three separate domains in stored
samples (i.e., sugar crystals, glucose-rich and trehalose-rich amorphous domains). Phase separation and crystallization were correlated with the loss of activity of the preserved enzyme. This study
evaluated the impact of formulations on protein stability.
5 Notes
1. The freezing loop is seen only when heat flow is plotted against
sample temperature. If the thermogram is a plot of heat flow
against time, the freezing event will appear as a normal peak.
2. Depending on the DSC model, one or two purge lines may be
needed, one for the DSC cell and another for the refrigerant
cooling system (RCS). Purified nitrogen gas is usually used as
Fig. 11 DSC thermograms of freeze-dried glucose/trehalose samples with glucose-6-phosphate dehydrogenase after storage at 60
C. For samples stored for 12 h or longer, arrows indicate glass transitions of glucoserich and trehalose-rich amorphous domains. Note that the size of the sugar crystal melting peak increases
with storage time. A scan rate of 10
C/min was used. Curves were redrawn according to [10]
300
Wendell Q. Sun
Mobility and Phase
Separation
DSC can also be used to study molecular mobility and relaxation.
Molecular mobility is related to the shelf life of preserved materials
at different storage conditions. Figure 11 shows an example where
DSC was used to study phase separation and crystallization of
freeze-dried glucose/trehalose with preserved glucose-6-phosphate dehydrogenase during storage. In the study [10], Sun and
Davidson used DSC to detect phase separation and crystallization
of freeze-dried samples during storage. Freeze-dried samples were
stored at an elevated temperature (60
C) for various durations,
and phase separation in samples is measured with a scan rate of
10
C/min. The study identified three separate domains in stored
samples (i.e., sugar crystals, glucose-rich and trehalose-rich amorphous domains). Phase separation and crystallization were correlated with the loss of activity of the preserved enzyme. This study
evaluated the impact of formulations on protein stability.
5 Notes
1. The freezing loop is seen only when heat flow is plotted against
sample temperature. If the thermogram is a plot of heat flow
against time, the freezing event will appear as a normal peak.
2. Depending on the DSC model, one or two purge lines may be
needed, one for the DSC cell and another for the refrigerant
cooling system (RCS). Purified nitrogen gas is usually used as
Fig. 11 DSC thermograms of freeze-dried glucose/trehalose samples with glucose-6-phosphate dehydrogenase after storage at 60
C. For samples stored for 12 h or longer, arrows indicate glass transitions of glucoserich and trehalose-rich amorphous domains. Note that the size of the sugar crystal melting peak increases
with storage time. A scan rate of 10
C/min was used. Curves were redrawn according to [10]
300
Wendell Q. Sun