

6. Place the cryostage under the microscope, and take several
pictures of the ice wafer at different areas, excluding the edges.
7. Repeat for each sample concentration, including the standard
solution, in triplicate.
3.5 Image Analysis
1. Transfer the photos onto a computer, and select one photo to
analyze per concentration trial (e.g., PBS trial #1, PBS trial #2,
etc.).
2. Open the selected photos in ImageJ software and change the
following settings:
(a) Analyze > Set Measurements > select “Area”; Decimal
places: “5”.
(b) Analyze > Tools > ROI Manager > select “Show All” and
“Labels”.
(c) Analyze > Set Scale > Distance in pixels: “2560”; Known
distance: “0.51”; Pixel aspect ratio: “1.0”; Unit of length:
“mm”.
(d) Select “polygon” from ImageJ palette.
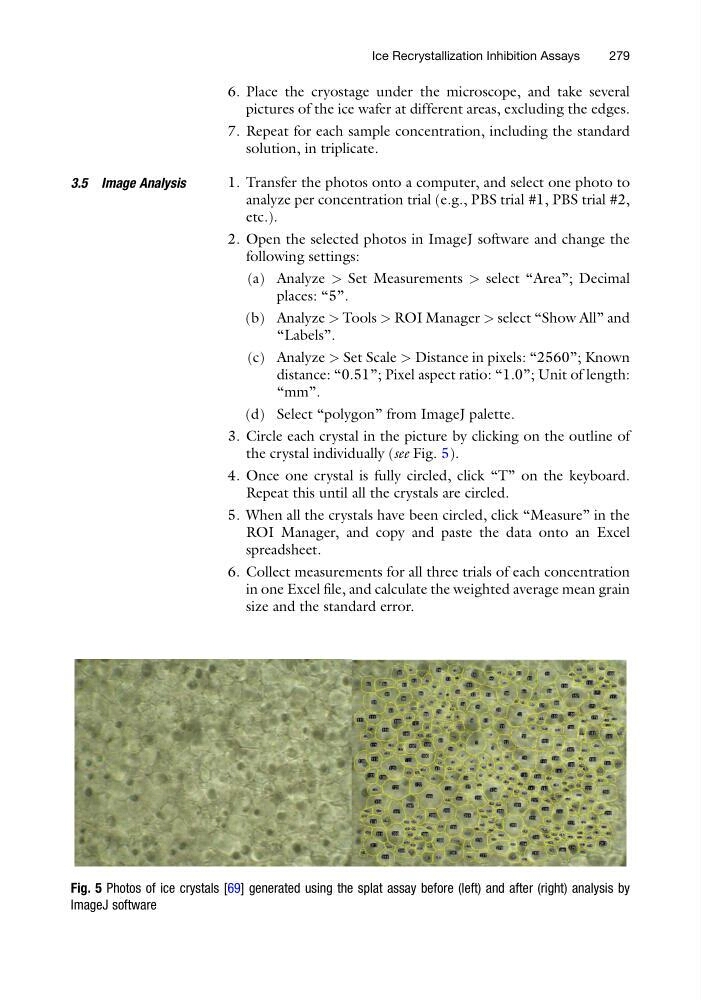
3. Circle each crystal in the picture by clicking on the outline of
the crystal individually (see Fig. 5).
4. Once one crystal is fully circled, click “T” on the keyboard.
Repeat this until all the crystals are circled.
5. When all the crystals have been circled, click “Measure” in the
ROI Manager, and copy and paste the data onto an Excel
spreadsheet.
6. Collect measurements for all three trials of each concentration
in one Excel file, and calculate the weighted average mean grain
size and the standard error.
Fig. 5 Photos of ice crystals [69] generated using the splat assay before (left) and after (right) analysis by
ImageJ software
Ice Recrystallization Inhibition Assays
279
pictures of the ice wafer at different areas, excluding the edges.
7. Repeat for each sample concentration, including the standard
solution, in triplicate.
3.5 Image Analysis
1. Transfer the photos onto a computer, and select one photo to
analyze per concentration trial (e.g., PBS trial #1, PBS trial #2,
etc.).
2. Open the selected photos in ImageJ software and change the
following settings:
(a) Analyze > Set Measurements > select “Area”; Decimal
places: “5”.
(b) Analyze > Tools > ROI Manager > select “Show All” and
“Labels”.
(c) Analyze > Set Scale > Distance in pixels: “2560”; Known
distance: “0.51”; Pixel aspect ratio: “1.0”; Unit of length:
“mm”.
(d) Select “polygon” from ImageJ palette.
3. Circle each crystal in the picture by clicking on the outline of
the crystal individually (see Fig. 5).
4. Once one crystal is fully circled, click “T” on the keyboard.
Repeat this until all the crystals are circled.
5. When all the crystals have been circled, click “Measure” in the
ROI Manager, and copy and paste the data onto an Excel
spreadsheet.
6. Collect measurements for all three trials of each concentration
in one Excel file, and calculate the weighted average mean grain
size and the standard error.
Fig. 5 Photos of ice crystals [69] generated using the splat assay before (left) and after (right) analysis by
ImageJ software
Ice Recrystallization Inhibition Assays
279