

2.5 Infrared and Raman Spectra
81
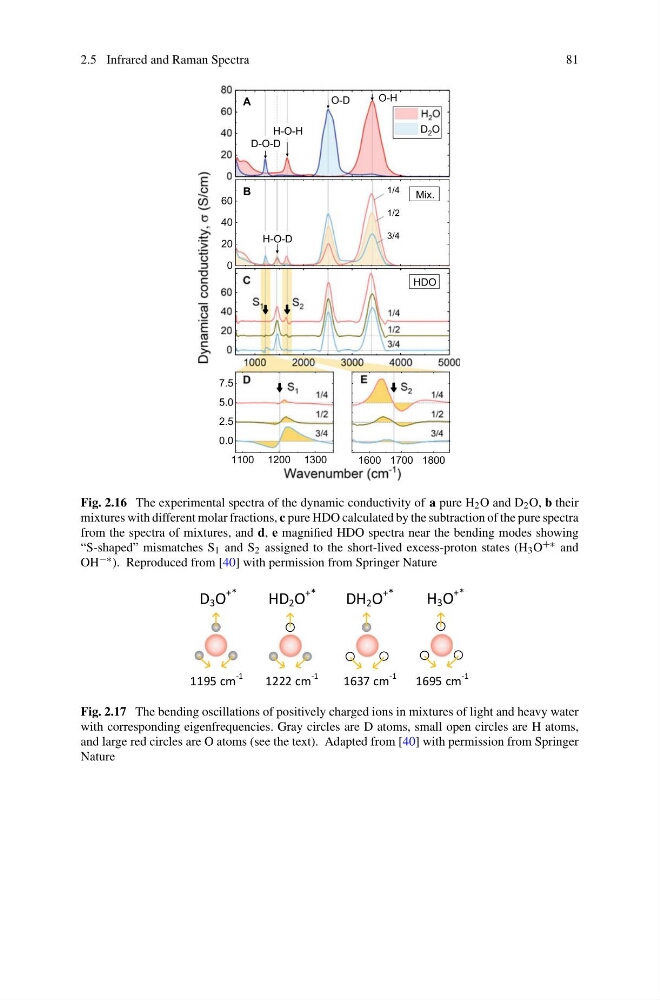
Fig. 2.16 The experimental spectra of the dynamic conductivity of a pure H 2 O and D 2 O, b their
mixtures with different molar fractions, c pure HDO calculated by the subtraction of the pure spectra
from the spectra of mixtures, and d, e magnified HDO spectra near the bending modes showing
“S-shaped” mismatches S 1 and S 2 assigned to the short-lived excess-proton states (H 3 O +∗ and
OH −∗ ). Reproduced from [40] with permission from Springer Nature
D 3 O
+*
HD 2 O
+*
DH 2 O
+*
H 3 O
+*
1195 cm
-1
1222 cm
-1
1637 cm
-1
1695 cm
-1
Fig. 2.17 The bending oscillations of positively charged ions in mixtures of light and heavy water
with corresponding eigenfrequencies. Gray circles are D atoms, small open circles are H atoms,
and large red circles are O atoms (see the text). Adapted from [40] with permission from Springer
Nature
81
Fig. 2.16 The experimental spectra of the dynamic conductivity of a pure H 2 O and D 2 O, b their
mixtures with different molar fractions, c pure HDO calculated by the subtraction of the pure spectra
from the spectra of mixtures, and d, e magnified HDO spectra near the bending modes showing
“S-shaped” mismatches S 1 and S 2 assigned to the short-lived excess-proton states (H 3 O +∗ and
OH −∗ ). Reproduced from [40] with permission from Springer Nature
D 3 O
+*
HD 2 O
+*
DH 2 O
+*
H 3 O
+*
1195 cm
-1
1222 cm
-1
1637 cm
-1
1695 cm
-1
Fig. 2.17 The bending oscillations of positively charged ions in mixtures of light and heavy water
with corresponding eigenfrequencies. Gray circles are D atoms, small open circles are H atoms,
and large red circles are O atoms (see the text). Adapted from [40] with permission from Springer
Nature