

1.5 Diffusion by Neutron Scattering
31
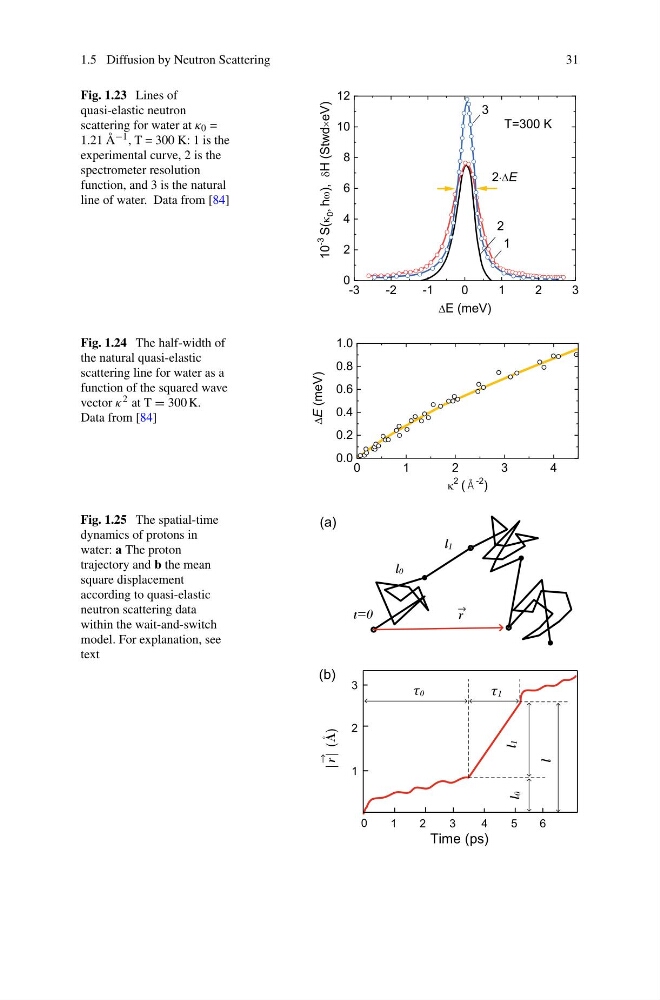
Fig. 1.23 Lines of
quasi-elastic neutron
scattering for water at κ 0 =
1.21 Å −1 , T = 300 K: 1 is the
experimental curve, 2 is the
spectrometer resolution
function, and 3 is the natural
line of water. Data from [84]
Fig. 1.24 The half-width of
the natural quasi-elastic
scattering line for water as a
function of the squared wave
vector κ 2 at T = 300 K.
Data from [84]
Fig. 1.25 The spatial-time
dynamics of protons in
water: a The proton
trajectory and b the mean
square displacement
according to quasi-elastic
neutron scattering data
within the wait-and-switch
model. For explanation, see
text
l1
l0
r
t=0
|r| (Å)
1
2
3
4
0
5
6
1
2
3
l1
l0
1
l
0
(a)
(b)
Time (ps)
31
Fig. 1.23 Lines of
quasi-elastic neutron
scattering for water at κ 0 =
1.21 Å −1 , T = 300 K: 1 is the
experimental curve, 2 is the
spectrometer resolution
function, and 3 is the natural
line of water. Data from [84]
Fig. 1.24 The half-width of
the natural quasi-elastic
scattering line for water as a
function of the squared wave
vector κ 2 at T = 300 K.
Data from [84]
Fig. 1.25 The spatial-time
dynamics of protons in
water: a The proton
trajectory and b the mean
square displacement
according to quasi-elastic
neutron scattering data
within the wait-and-switch
model. For explanation, see
text
l1
l0
r
t=0
|r| (Å)
1
2
3
4
0
5
6
1
2
3
l1
l0
1
l
0
(a)
(b)
Time (ps)