

Appendix
The Complex Dielectric Constant for Ice
and Water
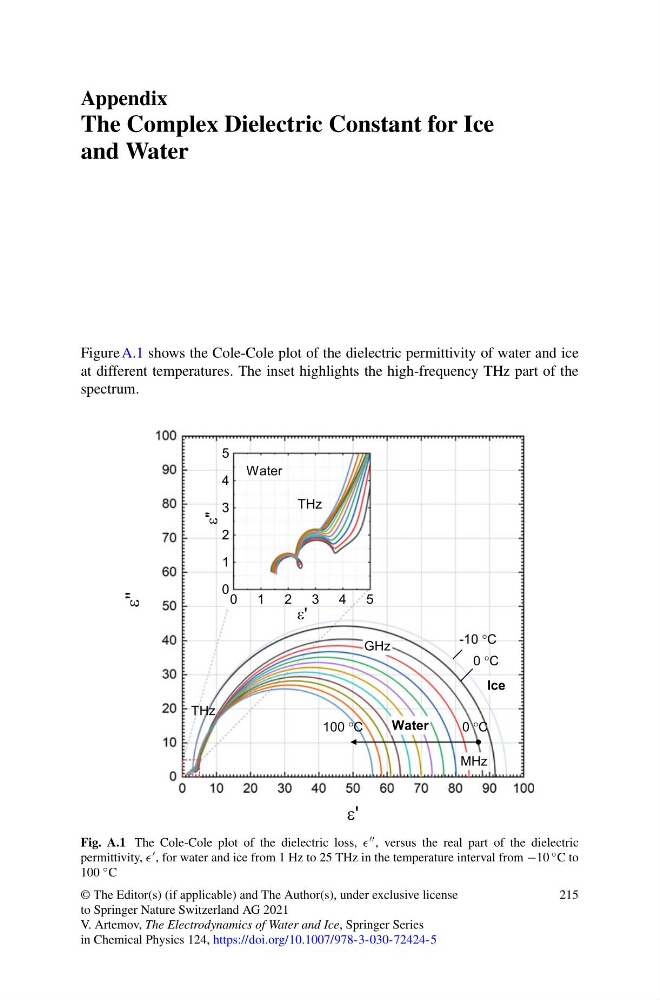
Figure A.1 shows the Cole-Cole plot of the dielectric permittivity of water and ice
at different temperatures. The inset highlights the high-frequency THz part of the
spectrum.
Fig. A.1 The Cole-Cole plot of the dielectric loss, , versus the real part of the dielectric
permittivity, , for water and ice from 1 Hz to 25 THz in the temperature interval from −10 ◦ C to
100 ◦ C
© The Editor(s) (if applicable) and The Author(s), under exclusive license
to Springer Nature Switzerland AG 2021
V. Artemov, The Electrodynamics of Water and Ice, Springer Series
in Chemical Physics 124, https://doi.org/10.1007/978-3-030-72424-5
215
The Complex Dielectric Constant for Ice
and Water
Figure A.1 shows the Cole-Cole plot of the dielectric permittivity of water and ice
at different temperatures. The inset highlights the high-frequency THz part of the
spectrum.
Fig. A.1 The Cole-Cole plot of the dielectric loss, , versus the real part of the dielectric
permittivity, , for water and ice from 1 Hz to 25 THz in the temperature interval from −10 ◦ C to
100 ◦ C
© The Editor(s) (if applicable) and The Author(s), under exclusive license
to Springer Nature Switzerland AG 2021
V. Artemov, The Electrodynamics of Water and Ice, Springer Series
in Chemical Physics 124, https://doi.org/10.1007/978-3-030-72424-5
215